Chapter 1: Introduction
Project context
Participatory research
Report organization
Chapter 2: Bram’s Addition and Burr Oaks Neighborhoods: Positive Attributes and
Challenges
What are good and livable communities?
Neighbors’ viewpoints
Revitalization and its possible consequences
Suggestions for the neighborhoods
Chapter 3: Homeowners
Background on homeowners
Home buying process
Home improvements
Advantages and disadvantages of homeownership
Suggestions to improve the housing situation for
present and future homeowners
Chapter 4: Tenants
Background on tenants
Maintenance schedules and repairs
Tenant and landlord relations
Advantages and disadvantages of renting
Tenants’ perceptions and experiences with home buying
Suggestions to improve the housing situation for
present and future tenants
Conclusions
Major themes
Next steps
Future research
Lessons learned
Appendices
Appendix A. Map of Study Area: Burr Oaks and Bram’s
Addition Neighborhoods
Appendix B. South Madison Demographic Map
Appendix C. Project Announcement for Recruitment of
Research Team Members
Appendix D: Homeowner Questionnaire
Appendix E: Tenant Questionnaire
Appendix F: Consent Form for Interviews
Appendix G: Preliminary Findings, Ideas for Future
Research, and Interview Guide
Notes
About the Authors
Acknowledgements
Chapter 1: Introduction
This report is based on a participatory research project conducted in the Bram’s Addition and Burr Oaks neighborhoods, which are located in the Southside of Madison, Wisconsin. The research team was mainly comprised of individuals with connections to South Madison with a few additional members from the University of Wisconsin (UW). Together they determined objectives, developed questionnaires for homeowners and tenants, constructed a user-friendly consent form, and interviewed residents.
The main goal of the research was to achieve an understanding of the housing situation and the neighborhoods from multiple perspectives and to develop suggestions to improve the neighborhood and housing situation that reflect the concerns of the community. To capture a diversity of viewpoints, the research team interviewed homeowners and tenants from both neighborhoods.1 This is a three phase project: the first phase was training and research; the second phase included data analysis, report writing, and dissemination of findings; and in the third phase, the research team will work to implement recommendations and action plans to improve the neighborhoods and the housing situation for residents.2
The research team hopes that by sharing this information other community members, organizations, and local governmental officials and staff will become their partners in learning, discussing, and working to make the necessary changes that will improve the housing situation for homeowners, tenants, and landlords and address existing issues affecting the neighborhoods.
Here we share some local history and demographic and physical characteristics of the South Madison area, explains the housing issue, and discusses participatory research. South Madison for the purpose of this study is the Southside neighborhoods that are adjacent to Park Street between Wingra Creek on the north and the Beltline Highway on the south.
I. Project context
A. South Madison
Park Street, which is considered the “Main Street” of the Southside, intersects other arterial streets and the Beltline Highway to connect commuters with destinations throughout Madison and the outlying communities (see Map of Study Area: Burr Oaks and Bram’s Addition neighborhoods, Appendix A). On the one hand, living along the corridor is an excellent location because of its close proximity to major destinations and ease of transit. In addition, the Park Street corridor is as an international street with restaurants and local shops reflecting the diverse community that thrives in the surrounding neighborhoods. On the other hand, Park Street is a six lane3 state highway that has traffic volumes ranging from 20,000 to 48,000 cars per day depending on the location.4 This corridor presently caters to vehicular transportation and has minimal pedestrian and bicyclist amenities and connections to neighborhood streets. Due to these conditions, this corridor has become a barrier between the west and east portions of South Madison. This heavy traffic and man-made barrier, which are constantly cited as concerns in the community, have led to partnerships where local stakeholders are working to transform Park Street into a multi-modal corridor with places and opportunities for people to gather and connect. A coffee shop has opened with sidewalk seating and farmers from the South Madison Farmers’ Market sell their produce along the corridor. The future is bright and the energy to revitalize the area is strong.
The vibrancy that is the future of Park Street is already seen in the surrounding South Madison neighborhoods where there is an energy radiating from the community, people, and greenery. There are mature trees growing tall, green lawns, community gardens, sprouting flowers, kids playing and riding bicycles, residents in their yards or walking on the sidewalks, and people chatting with each other. Take a walk down the streets and residents say hello. These are the neighborhoods of Bram’s Addition and Burr Oaks.
These neighborhoods have a rich history that began in the late 1800s. “While the settlement of South Madison began late in the 19th century, it was hastened by the destruction of the Greenbush neighborhood, (‘the Bush’), bulldozed in the late 1950’s as Urban Renewal came to Madison.”5 The Bush (located just north of South Madison) was “an ethnic enclave where immigrants black, white, and Jewish from Eastern and Western Europe settled, in part because they were not welcome in other parts of Madison.”6 Longtime community activist Richard Harris, Ph.D., “remembers the 1930’s and 1940’s when parts of South Madison were still a swamp.” Ben Parks, who came to Madison in 1953, recalls the “outhouses in the neighborhood because people did not yet have indoor plumbing. Melva McShan remembers neighbors raising chickens and pigs in South Madison back when Bram’s Addition was an outlying area commonly known as ‘Hell’s Half-acre.’”7
As displaced Bush residents moved south, this increase in population resulted in the redevelopment of land into a variety of uses; paving of streets; installation of curbs, gutters, and sidewalks; building of storm and sanitary sewers; and planting of trees. In 1966, John Nolen Drive, a causeway that runs along side South Madison, was built and linked South Madison to downtown. This new road further contributed to an increase in population and development.8
To this day, South Madison has a diverse ethnic population. South Madison has the most diverse census tract in all of the City of Madison with the breakdown as follows: 31.5% are White, 31.2% are Black, 21.1% are Asian or Pacific Islander, 20.7% are of Hispanic Origin (any race), 4.5% are two or more races, 0.5% are Native American, and 11.1% are classified as Other.9 From 1990 to 2000, these neighborhoods experienced a 503.8% increase of persons of Hispanic origin compared to 119.6% for City of Madison (Table 1.1). For more information regarding comparisons between Bram’s Addition, Burr Oaks, Town of Madison, and City of Madison, see Table 1.4.
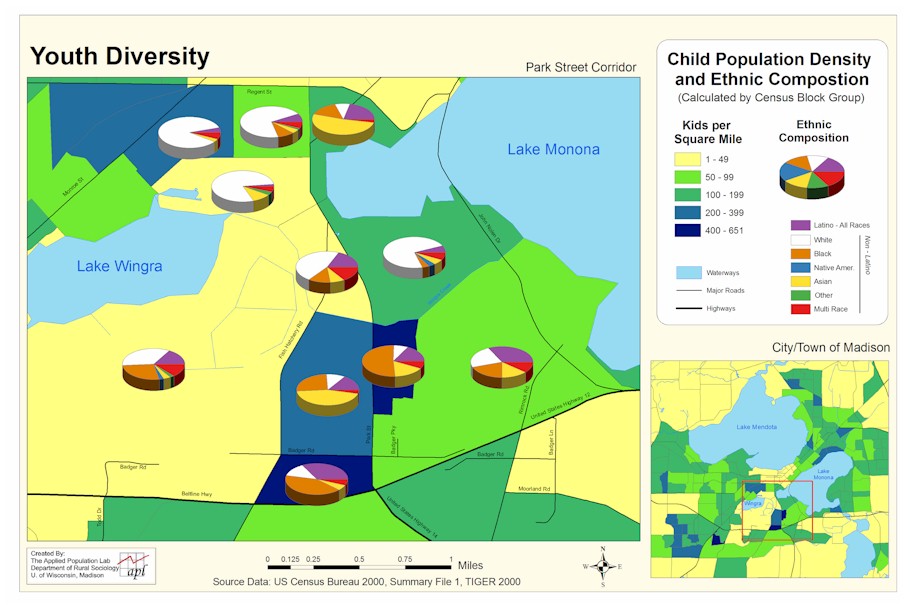
In addition, this area is economically disadvantaged. In 1999, families living in poverty were four times higher in the project census area (26.9%) than the City of Madison (5.8%), and the median household income of $26,296 was less than the Citywide median of $41,941.10 There are 3,829 residents in the census area with a larger concentration of young people than the City of Madison as whole11 (see South Madison Demographic Map, Appendix B).
|
Table 1.1 Comparison
of economic and housing indicators between
South Madison and City of Madison12 |
||
|
Economic
and housing indicators |
South Madison |
City of Madison |
|
Change in Hispanic population from 1990-2000 |
503.8% |
119.6% |
|
Families in poverty |
26.9% |
5.8% |
|
Household median income |
$26,296 |
$41,941 |
|
Owner-occupied homes |
21.8% |
47.7% |
|
Renter-occupied homes |
78.2% |
52.3% |
As compared to the rest of Madison, South Madison is less expensive and has different mixes of housing types and ownership arrangements. In 2000, 21.8% were owner-occupied and 78.2% were renter-occupied, as compared to 47.7% owner-occupied and 52.3% renter-occupied for the City of Madison.13 As in other parts of the country, Madison housing prices have increased significantly in the past decade with the price of the average valued home increasing 104% from $109,686 in 1994 to $223,800 in 200514 (Box 1.1). In 2000, Bram’s Addition had a median value of $91,200 for an owner-occupied home, while Burr Oaks had a median value of $78,200 for the area south of West Badger and $93,900 for the area north of West Badger. This is compared to a median value for an owner-occupied home of $139,300 for the City of Madison. For rental properties in 2000, Bram’s Addition had a median gross monthly rent of $558 for the study area, while Burr Oaks had a median gross monthly rent of $577 for the area south of West Badger and $584 for the area north of West Badger. This is compared to a median gross monthly rent of $644 for the City of Madison15 (Table 1.4).
|
Box 1.1 Putting
housing prices in perspective
|
|
To put
the housing prices in perspective with wages earned, a household
would have to earn $43,867 gross per year to pay the necessary
monthly $1096.68 (mortgage/real estate taxes/insurance) that
would allow them to purchase a $157,000 house at 6.450% interest
and amortized for 30 years.16
If the household is interested in renting an apartment for
$647, “in order to afford this level of rent and utilities,
without paying more than 30% of income on housing, a household
must earn $2,157 monthly or $25,887 gross annually.17
Assuming a 40-hour work week, 52 weeks per year, a person would
have to earn $12.45/hour to afford this housing and not pay more
than 30% of their income.”18 |
B. The housing issue
South Madison residents’ concerns about the status of the housing stock and affordability surfaced when the South Metropolitan Planning Council (SMPC)19 worked with community residents and other stakeholders between 2000 and 2001 to develop a vision for South Park Street.20 South Madison residents expressed concerns such as revitalization will drive up rents, taxes may increase, and people will never be able to afford the purchase of housing in South Madison. These concerns are also shared by experts in the housing field, as expressed by Paul Jasenski, who has 20 years experience as the Housing Development Manager for Common Wealth Development.21 According to Jasenski, “Even ten years ago, I never thought housing prices would get so high in the Willy [Williamson] Street neighborhood, and I predict in the future we are going to be seeing the same thing happen in South Madison.”22
South Madison residents who participated in the Park Street visioning process also expressed concerns regarding past revitalization efforts in Madison because they believed that community members had little voice or influence in the planning. This top-down planning “contributed to tensions in the area because they were imposed on community members rather than cooperatively planned.”23
In order to address community concerns and increase involvement of local residents in the revitalization efforts, SMPC collaborated with University of Wisconsin-Madison (UW-Madison) to develop community teams. Community teams are comprised of volunteer residents who work to gather information on a topic of interest to the community; exchange this information and acquire feedback from the larger South Madison community; and collaborate with their neighbors, businesses, and government to implement physical and policy improvements.
The first community team to be developed focused on housing due to residents’ concerns that a consequence of the revitalization would be a loss of affordable housing. The South Madison Housing Community Team’s goals are to 1) ensure quality and affordable housing, 2) rehabilitate existing housing stock, and 3) build community. They realized to gain a full understanding of the housing issue it was necessary to gather information in a systematic manner and involve underrepresented groups in the process. Thus, they obtained funding to embark on an innovative participatory research project called South Madison Housing Stories and Experiences. The goals for this project were to be inclusive of residents in the research process and to thoroughly and systematically collect information about housing from a variety of perspectives (homeowners, tenants, and landlords). The purpose of collecting this information was to develop a workable action plan for housing stock and policies that reflect the concerns and interests of the South Madison community.
The study area for South Madison Housing Stories and Experiences project is the Bram’s Addition and Burr Oaks neighborhoods. These neighborhoods were chosen because they are located adjacent to Park Street and will be affected by the revitalization plans and are comprised of significant numbers of residents who were economically disadvantaged and underrepresented. In addition, local residents expressed concern about maintaining affordable, quality housing and not displacing current residents.
II. Participatory research
A unique aspect of South Madison Housing and Experiences is that it focuses on engaging local voices in two ways: 1) residents are engaged in all aspects of the research process including the study design and interviewing community members and 2) residents’ opinions and experiences are collected. This type of research process, called participatory research, is a valuable method for building the skills of local residents, gathering reliable and useful information, strengthening collaborations, and increasing participants’ ownership of the project as a whole. Building collaborations and increasing ownership during the research process builds a strong foundation for varied stakeholders working together to initiate action that can influence community changes and policy.
Participatory research taps into local knowledge and gives voice to individuals whose ideas and concerns are critical for a full understanding of an issue. This differs from a traditional research model that has outside researchers, usually from a university, seek information pertaining to their interests and community members answer questions from which they rarely see outcomes. Furthermore, in community planning, there can be a tendency towards relying on existing demographic information and public forums, which many times draw the same players, without more systematic inclusion of all the possible resident opinions and experiences. Considering that residents are the stakeholders who will directly experience the positive and negative effects of community changes, their involvement for identifying issues and implementing changes is critical.
In participatory research, community members are active in the entire research process that includes setting objectives, designing questions, and gathering information.24 Thus, the research focus and outcomes reflect resident needs, interests, and circumstances. Resident involvement during the research stage can also increase the likelihood of their engagement in working towards change in the community. This study demonstrates that there are a significant number of residents in South Madison that value the area, have long-term hopes and visions for their neighborhood, and can be a base for building a stronger community. The following is a description of the participatory research process that was used in this study.
Recruitment. In fall 2004, the project coordinators25 publicized this project (see Project Announcement, Appendix C) and brought together local residents to form a research team that represented a broad range of backgrounds (e.g. economic, homeowner/tenant, race/ethnicity, age). The research team was primarily comprised of individuals with connections to South Madison. Their connections to South Madison included currently residing or having lived in the study area and/or working on issues associated with South Madison.
Training. When recruited to work on a participatory research project, community members come with their own expertise that they have gained from their life experiences. They have an extensive knowledge of their community, but may lack the research skills and an understanding of how to develop a research project. Thus, in participatory research, the training is an essential component in order to expose community members to the concepts of research, learn skills and techniques, and develop a well-designed project.
During weekly training meetings, a facilitator, who is also a local resident,26 introduced the research team to the general concepts of research (e.g. triangulation, bias, confidentiality, recording information) and incorporated exercises on objective setting, team building, and presenting. In order to gain experience, research team members learned a technique, such as interviewing, and then practiced it on each other and their family and friends.
Research Design.
During the training period (September 2004 to May 2005), the
research team developed a research design that included 1) how
information would be gathered (i.e. the methods), 2) who would be
interviewed (i.e. sample), and 3) how residents would be approached
and their participation obtained (i.e. obtaining consent). Though
the original intent of South Madison Housing Stories and
Experiences was to study housing, the specific objectives (Box
1.2) and research design were a product of the research team’s
active involvement.
|
Box 1.2 Project objectives |
|
The
research team wanted to learn from their neighbors: 1) qualities that make a good housing situation and desirable neighborhood for homeowners and tenants, 2) main issues regarding housing for homeowners and tenants, and
3) needs to be addressed in terms of housing and
neighborhoods. |
a) Research Methods. In order to learn more about their project objectives, the research team decided to develop questionnaires (see Homeowner and Tenant Questionnaires, Appendices D and E) and interview residents individually rather than collectively (e.g. focus groups). In South Madison, there have been other opportunities for obtaining collective discussion such as during planning meetings and other forums.27 The research team believed that it was important for this project to complement existing information by obtaining individual data on each resident and for each respondent to have privacy in answering questions without others present.
Two questionnaires were constructed: one for tenants, and another for homeowners that included both open-ended and closed-ended questions.28 The research team decided they would conduct door-to-door interviewing in order to talk to residents individually.
b) Sample. After the research team decided to conduct door-to-door interviews, they needed to decide on a systematic method to choose residents for interviews. The research team wanted a systematic method for selecting residents in order to ensure that their findings reflected the experiences and opinions of all the residents and not, for example, only particular individuals they knew. The research team decided to use a sampling technique called “cluster sampling.” In this approach, they assigned numbers to each block in the Bram’s Addition and Burr Oaks neighborhoods and then randomly selected 10 blocks from each of the neighborhoods. Thus, each block had the same likelihood of being selected. The research team members then interviewed a resident over the age of 18 from each household on the blocks selected.29 The research team decided to use cluster sampling rather than other techniques30 for selecting residents because they wanted a random sample with a modest budget and time frame. Cluster sampling is ideal for these purposes since research team members interview on designated blocks and could visit one resident after another without having to spend time looking for separate houses throughout the neighborhoods. Due to accessibility issues, buildings with more than four units were left out of the sample. Thus, the sample and, therefore, the study do not include residents who live in large apartment buildings.
Comparing the project’s sample to the neighborhoods’ populations (Table 1.3), the major difference between them is in ownership status. Due to the decision to exclude any building structures with more than 4 units (see section, Future research), the research team interviewed many more homeowners and many less tenants than is reported in the 2000 Census information for the two neighborhoods. This means that the large apartment complexes where many tenants in both Bram’s Addition and Burr Oaks reside were not part of our sample. This decision may explain other observed differences between the sample and the actual population of both neighborhoods. For example, the research team interviewed more residents ages 40 to 59 and more residents with a Bachelor’s or Post College education than is observed in the actual population of both neighborhoods. This may mean that younger people and those with less education are more likely to be tenants living in the larger complexes. Due to the decision to exclude larger structures, the sample is representative of those living in building structures of 4 units or fewer and not representative of those living in larger structures.
c) Obtaining Consent. Because the project was associated with UW and the research team wanted to make sure that they abided by the standards of ethical research, they collaborated with a faculty member at the UW-Madison and acquired permission to conduct the research from the UW’s Human Subjects Committee of the Institutional Review Board. Since the information collected would be anonymous (i.e. names would not be collected and the information could not be tracked back to any particular resident), it was not obligatory for the research team to obtain signed consent forms. However, the research team wanted the residents to be able to understand the project goals, objectives, and the way the information would be used, so they constructed a user-friendly consent form. The research team members reviewed this form at the beginning of each interview and left one with each resident for future reference (see Consent Form for Interviews, Appendix F).
Data Collection. With practice under their belts and housing on their minds, research team members knocked on doors in Bram’s Addition and Burr Oaks neighborhoods in the summer of 2005 (Table 1.2). The research team worked in pairs to facilitate recording and cross-checking of information.31 Each pair worked in designated blocks and they decided who would be the interviewer and who would be the recorder. The residents interviewed were very friendly and generous with their time and invited research team members to sit on their stoop or lawn chairs, while patiently answering questions from twenty minutes to sometimes over an hour. The research team first worked on interviewing residents from one neighborhood. Due to the generosity of respondents’ time and interest in answering questions, the interviews took longer than expected in the first neighborhood so additional research team members were recruited to assist in the second neighborhood.
Analysis. After the research team collected the data, both quantitative and qualitative information was entered into a database and analyzed. Two questionnaires generated an enormous amount of data and allowed for rich analysis. However, the analysis was more labor intensive and time consuming than expected and required certain technical skills that had not been originally anticipated. Due to the work involved, only a few research team members (facilitator, project coordinators, and one community member) participated in the analysis and interpretation of the initial findings rather than the whole research team (see Conclusions--Lessons learned).
The qualitative information obtained through the open-ended questions was examined for similarities and differences and then coded. In some cases, in order to assess the relationship between different groups, statistical analysis was conducted. Using statistical tests and checking for whether there is statistical significance between groups can show whether the observed differences between the groups being compared are a product of chance alone or evidence of a real relationship. The analysis that was conducted on the data is shown in tables throughout the report. The differences that are statistically significant are indicated by asterisks: two asterisks indicate stronger evidence of a relationship than one asterisk.
Feedback and Action. After a summer of speaking with South Madison residents, the research team learned a great deal about their neighbors, housing situations, and community. These findings are explained in this report and are being shared at community meetings and other venues. The findings will also be presented in other written material such as fact sheets, newsletters, and websites. This dissemination of information allows research team members to present their findings, request feedback, and invite collaboration. This dissemination of information will assist in the building of a collaborative partnership between community members and other stakeholders so they can work together to improve housing policies and stock; better the situation for homeowners, tenants, and landlords; and address any existing issues affecting the neighborhoods.
The development of action plans and the target recommendations implemented will depend on the interests of the collaborating partners, feedback from the findings, and available support.
III. Report organization
The
remainder of the report explains the research findings. Next, we discuss the neighborhoods’ positive attributes and areas for
improvement. Then we focus on homeowners’ perspectives on
the housing situation, followed by a discussion of tenants’
perspectives. Each section includes suggestions that arose
from speaking to residents and from the research team’s
findings. The Conclusion provides next steps and
future research, and lessons learned from this project. This report,
as well as all appendices, can be accessed through web links.32
|
Table 1.2 Demographic
characteristics of individuals interviewed |
|||
|
Demographic characteristics |
Homeowners |
Tenants |
All residents interviewed |
|
Neighborhood33 |
|
|
|
|
Bram’s Addition (n=5934) |
57% |
49% |
54% |
|
Burr Oaks (n=50) |
43% |
51% |
46% |
|
Gender |
|
|
|
|
Female (n=62) |
51% |
70% |
58% |
|
Male (n=45) |
49% |
30% |
42% |
|
Race and/or ethnicity35 |
|
|
|
|
White (n=46) |
49% |
38% |
45% |
|
Black or African American (n=33) |
29% |
38% |
32% |
|
Latino or Hispanic (n=8) |
7% |
9% |
8% |
|
Asian (n=12) |
13% |
9% |
12% |
|
Other: Bi-racial/Bi-cultural, etc. (n=3) |
1% |
6% |
3% |
|
Education |
|
|
|
|
Less than High School or some High School (n=19) |
21% |
14% |
18% |
|
GED or High School Diploma (n=21) |
13% |
32% |
20% |
|
Some college or Associate’s Degree (n=30) |
25% |
35% |
29% |
|
Bachelor’s Degree or Post College (n=34) |
40% |
19% |
33% |
|
Stress36 |
|
|
|
|
About 30% or less (n=41) |
40% |
44% |
41% |
|
31% to 50% (n=27) |
30% |
22% |
27% |
|
More than 50% (n=31) |
30% |
33% |
31% |
|
Age |
|
|
|
|
18 to 29 (n=23) |
10% |
43% |
22% |
|
30 to 39 (n=20) |
21% |
16% |
19% |
|
40 to 49 (n=26) |
32% |
11% |
25% |
|
50 to 59 (n=24) |
24% |
22% |
23% |
|
60 to 69 (n=8) |
9% |
5% |
9% |
|
70 or more (n=4) |
4% |
3% |
4% |
|
Length of time in South Madison |
|
|
|
|
Less than a year (n=13) |
10% |
16% |
12% |
|
1 to 4 years (n=28) |
19% |
41% |
26% |
|
5 to 10 years (n=19) |
16% |
22% |
18% |
|
11 to 20 years (n=26) |
30% |
14% |
24% |
|
More than 20 years (n=21) |
26% |
8% |
20% |
Total number of residents |
72 |
37 |
109 |
|
Table 1.3 Demographic characteristics of residents 18 years or older of Bram’s Addition (BA) and Burr Oaks (BO)* compared to residents interviewed (sample)
|
||||||
|
Demographic characteristics |
BA (n=654) |
BA sample (n=59) |
BO (n=2,089) |
BO sample (n=50) |
BA & BO (n=2,743) |
BA & BO sample (n=109) |
|
Gender |
|
|
|
|
|
|
|
Female |
349 (53%) |
32 (55%) |
1016 (49%) |
30 (61%) |
1365 (50%) |
62 (58%) |
|
Male |
305 (47%) |
26 (45%) |
1073 (51%) |
19 (39%) |
1378 (50%) |
45 (42%) |
|
Race and/or ethnicity |
|
|
|
|
|
|
|
White |
186 (28%) |
24 (45%) |
799 (38%) |
22 (45%) |
985 (36%) |
46 (45%) |
|
Black or African American |
283 (43%) |
18 (34%) |
425 (20%) |
15 (31%) |
708 (26%) |
33 (32%) |
|
Latino or Hispanic |
80 (12%) |
6 (11%) |
498 (24%) |
2 (4%) |
578 (21%) |
8 (8%) |
|
Asian |
79 (12%) |
3 (6%) |
329 (16%) |
9 (18%) |
408 (15%) |
12 (12%) |
|
Other: American Indian, Bi-racial etc. |
26 (4%) |
2 (4%) |
38 (2%) |
1 (2%) |
64 (2%) |
3 (3%) |
|
Education* |
|
|
|
|
|
|
|
Less than High School or some High School |
203 (37%) |
9 (16%) |
490 (31%) |
10 (21%) |
693 (32%) |
19 (18%) |
|
GED or High School Diploma |
134 (25%) |
9 (16%) |
367 (23%) |
12 (26%) |
501 (23%) |
21 (20%) |
|
Some college or Associate’s Degree |
164 (30%) |
16 (28%) |
531 (33%) |
14 (30%) |
695 (32%) |
30 (29%) |
|
Bachelor’s Degree or Post College |
44 (8%) |
23 (40%) |
213 (13%) |
11 (23%) |
257 (12%) |
34 (33%) |
|
Age |
|
|
|
|
|
|
|
18 to 29 |
190 (29%) |
11 (19%) |
791 (38%) |
12 (25%) |
981 (36%) |
23 (22%) |
|
30 to 39 |
152 (23%) |
11 (19%) |
547 (26%) |
9 (19%) |
699 (25%) |
20 (19%) |
|
40 to 49 |
138 (21%) |
15 (26%) |
357 (17%) |
11 (23%) |
495 (18%) |
26 (25%) |
|
50 to 59 |
63 (10%) |
15 (26%) |
180 (9%) |
9 (19%) |
243 (9%) |
24 (23%) |
|
60 to 69 |
51 (8%) |
5 (9%) |
97 (6%) |
3 (6%) |
148 (5%) |
8 (8%) |
|
70 or more |
60 (9%) |
0 (0%) |
117 (6%) |
4 (8%) |
177 (7%) |
4 (4%) |
|
Ownership status |
|
|
|
|
|
|
|
Owner-occupied units |
100 (28%) |
41 (69%) |
258 (24%) |
31 (62%) |
358 (25%) |
72 (66%) |
|
Renter-occupied units |
256 (72%) |
18 (31%) |
823 (76%) |
19 (38%) |
679 (75%) |
39 (34%) |
* Information is from the 2000 census. For BA and BO, 2000 census information counts education for those 25 and older; for research sample, education is counted for all residents interviewed (18 years or over).
|
Table 1.4 Comparison of economic and housing indicators between Bram’s Addition, Burr Oaks, Town of Madison, and City of Madison*
|
||||
|
Economic and housing indicators
|
Bram’s Addition |
Burr Oaks |
Town of Madison |
City of Madison |
|
Change
in Hispanic population from 1990-2000 |
241% |
562% |
524% |
119.6% |
|
Persons
with income below poverty |
31% |
32% |
24% |
15% |
|
Household median income |
$30,625 |
$22,540 (south of W. Badger)
$28,571 (north of W. Badger)
|
$29,766 |
$41,941 |
|
Owner-occupied homes |
28% |
24% |
24% |
48% |
|
Renter-occupied homes |
71% |
76% |
76% |
52% |
|
Median value of owner- occupied homes |
$91,200 |
$78,200 (south of W. Badger)
$93,900 (north of W. Badger)
|
$97,200 |
$139,300 |
|
Median gross monthly rent |
$558 |
$577 (south of W. Badger )
$584 (north of W. Badger)
|
$584 |
$644 |
*Information from 2000 census.
Chapter 2: Bram’s Addition and Burr Oaks Neighborhoods: Positive Attributes and Challenges
Communities, urban planners, and developers have discussed and debated for years the attributes that result in a good and livable neighborhood. For South Madison Housing Stories and Experiences, the research team asked the Bram’s Addition and Burr Oaks residents to share their thoughts on this issue. The qualities of the neighborhood affect how residents’ perceive their overall housing situation; therefore, the research team thought it was important to include questions on the neighborhood in this project. Here we present residents’ perceptions of their neighborhoods’ positive attributes and challenges, while also offering suggestions for improvement.
I. What are good and livable communities?37
Currently, communities, urban planners, and developers are focusing attention on identifying the characteristics of good and livable communities and how they are created. In the period after World War II, the subsidizing of highway development, home buying loans that favored single-family homes instead of multi-unit dwellings, development of strip malls, increasing reliance on automobiles, and a variety of other factors, spread cities outward and produced urban sprawl. This development resulted in an increase of automobile usage and need for parking lots, highways, and streets that was detrimental to pedestrians and not conducive to bicycles. However, in the last few decades there have been movements, such as New Urbanism, that seek to once again develop community among neighbors by decreasing traffic, eliminating sprawl, and developing livable and walkable communities.
One urban writer and community activist, Jane Jacobs, observed the positive attributes of neighborhoods in urban settings. In her influential book that has become a classic, The Death and Life of Great American Cities (1961), Jacobs highlighted that economic, architectural, and human diversity was critical for vibrant cities and argued that mixed-use planning, meaning dwellings with retail and short walkable blocks, was essential for communities to thrive; not orderly development plans that replaced whole neighborhoods.
Such discussions regarding the principles of design are important for existing neighborhoods as well as for new developments. A recent local effort to engage in these discussions, Great Neighborhoods: How to Bring Them Home,38 defines the characteristics of great neighborhoods and gives examples of local communities that include these qualities or housing developments trying to incorporate them. The definition in the Great Neighborhoods report reflects Jane Jacob’s theory of walkable and livable cities.
“Great neighborhoods bind homes together with active and pedestrian-friendly streets, high-quality civic open spaces, local and distinctive shopping opportunities, flexible and appealing employment locations, accessible and neighborhood-scaled schools, preserved wild spaces, and more.”39
The Bram’s Addition and Burr Oaks neighborhoods have many of the positive attributes defined in Great Neighborhoods and include different types of housing (price, size, layout, ownership), a mixed-use area (residential as well as retail), human scaled streets (short blocks in the neighborhood with sidewalks), and nearby amenities and public spaces (stores, restaurants, social services, and parks).
The research team was interested in understanding what residents’ believed are the positive qualities that make Bram’s Addition and Burr Oaks good and livable communities, as well as the problems that need to be addressed. The remainder of Chapter 2 presents community members’ perspectives on their neighborhoods’ positive qualities, difficulties, as well as suggestions for improvement.
II. Neighbors’ Viewpoints
A. Social aspects
1. Sense of community and good neighbors
Proponents for good and livable communities strive to cultivate a “sense of community,”40 which means that residents have good feelings towards their community in terms of the general atmosphere and the people. A sense of community is the most common reason homeowners (53%) and tenants (54%) in Bram’s Addition and Burr Oaks stated for liking their neighborhood (Table 2.2, page 21).
A sense of community was also a reason residents were drawn to these neighborhoods and continue to live here (Table 2.3). Whereas only 14% of homeowners and 19% of tenants mentioned having moved here because of a sense of community, 32% of homeowners and 54% of tenants commented that it was a major reason why they continued living here. This strong sentiment did not vary by race and ethnicity.
The positive interactions residents had with their neighbors were an important component in their upbeat perceptions towards their community. The neighborhood offers opportunities (e.g. public spaces, layout of streets) for residents to get to know one another, watch out for each other, and respect one another. Some comments made by residents are the following:
“people help each other and talk to you”;
“there is good communication with the neighbors”;
“there are good people who live here, they watch out for each other”;
“kids give back by helping the neighbors”; and
“kids can play outside with kids of all ages.”
Yet, some residents felt that there was a need to improve relations both among community members and between outsiders (i.e. strangers, visitors) and local residents (Tables 2.4 and 2.5). Within the neighborhood, poor relationships among community members seemed to focus on a lack of respect for other residents such as being noisy, or strangers hanging out and being disrespectful or loud. As one resident said, “it’s a few neighbors and their visitors are noisy.” Residents in Bram’s Addition mentioned a need to improve community relations more than Burr Oaks.
Furthermore, residents believed that the greater Madison community has a negative perception of South Madison and thinks of the area as an undesirable place to live. They believe that their neighborhoods receive bad press from the media and they would like there to be “more understanding of [South Madison] as a nice place.” (For more information, see Safety and neighborhood disturbances, page 16.)
2. Shared personal and cultural background and diversity
One of the major reasons homeowners and tenants moved into the Bram’s Addition and Burr Oaks neighborhoods was that they had either personal or cultural ties with other residents. This was commonly expressed by homeowners (33%) and tenants (35%). A personal tie meant that a resident or a spouse was born and raised in the neighborhood or that someone they knew such as a friend or relative lived in the community or nearby. A cultural tie meant that residents shared identities, such as religion or race or ethnicity, with other residents. A few residents said that they liked that their neighbors resembled their cultural background, one resident said he liked that others in the neighborhood “looked like me.” One Asian resident said that he liked that there were a lot of other Asian families in the area. This category, shared personal and cultural ties, was cited fewer times as a reason that residents stayed in the neighborhoods.
There were a few differences between residents. While 39% to 59% of African Americans, Latinos, and Asians mentioned personal and cultural ties as a reason for moving into the area, it was only mentioned by 28% of Whites. Also, personal and cultural ties were mentioned frequently by residents who have lived in South Madison over 20 years. For example, 52% of residents who had lived in the area for over 20 years mentioned personal and cultural ties as a reason for moving here compared to 23% of residents who had lived in the area for less than one year.
On the other side of the coin, far fewer people mentioned that diversity, in terms of residents’ differing cultural and economic backgrounds, was a reason for moving here and continuing to live here. Residents expressed what they liked about diversity in South Madison:
One resident also shared another side of the diversity issue. She shared that she felt discriminated against in the community and that “some residents have been here longer time and are nervous about accepting new people. There is no interacting cross race or cross culture.”
Given the prevalence of economic and cultural diversity in these neighborhoods, the improvement of community relations and development of collaborations among diverse groups is an important goal. It should be noted that this study did not set out to examine issues of diversity and, therefore, sheds little light on this important topic (see Conclusion--Future research).
“different lifestyles get along”;
“[South Madison is] so diverse culturally, Asian-American families, black folks, old folks”;
“I like diversity, it enriches me”; and
”cultural diversity and economic diversity, everyone is not middle class.”
3. Safety and neighborhood disturbances
The main concern residents had about their neighborhoods was safety and neighborhood disturbances. Fifty-three percent of homeowners and 52% of tenants mentioned issues of safety and neighborhood disturbances as aspects of what they did not like about their neighborhood.
Drugs and crime were of major concern. Some residents stated that there were known drug houses in the neighborhood and they had complained to the police and the City of Madison, but the activity continued. One resident, who lived near a drug house known by neighborhood residents, shared her frustrations and concerns with research team members for over two hours. She described how cars were constantly driving up to the drug house and how several times people looking to buy drugs mistakenly knocked on her door. In addition, she mentioned that there were fights and there were times when she was fearful that the arguments would escalate into gunfights and endanger the neighborhood children. She knew the landlord was aware of the problems and that neighbors had called the police, but she had yet to see any changes.
Another homeowner who was frustrated about the drug dealing that goes on near her home and was concerned about the safety of her children stated, “drugs and dealing is the number one concern – [it happens] in our alley and there is a crack house nearby, there is lots of traffic [due to drug dealing]. We called the cops [about the drugs] but there is racial profiling and they are not very friendly. We don’t want our kids going up there [the alley] because of the problems. In the afternoon, there is lots of action; people are hanging out.”
In addition, residents believe that people drive their cars too fast down neighborhood streets and endanger children. As one resident commented, “It is the way people drive up and down the street – they don’t pay attention to children. This is very residential and there are lots of kids.” One other complaint was noise, especially from people hanging out in cars and some community members thought this was possibly due to drug dealing.
The percentage of residents concerned about safety was roughly similar across neighborhoods (49% in Bram’s Addition and 56% in Burr Oaks). Homeowners and tenants of all race and ethnic groups and educational levels cited safety as one of the top challenges that needs to be addressed. Within each neighborhood, however, concerns of safety varied. Of all residents in Burr Oaks who mentioned crime and disturbances as something they did not like about their neighborhood, 79% resided on two of the ten Burr Oaks research blocks. Similarly, of all residents in Bram’s Addition who mentioned crime and disturbances as something they did not like about their neighborhood, 64% resided on two of the Bram’s Addition blocks that were closer to the drug houses.
A few residents mentioned that South Madison’s image may be playing a role in terms of encouraging crime. They believed that negative images make their neighborhoods seem like a permissible atmosphere for illicit activities. This gives people an excuse to come to their neighborhoods to “hang out and sell drugs.” Furthermore, a lack of respect for the community makes it so “it's ok to trash it or steal from it because it’s the Southside; outsiders keep driving in and think it’s ok to trash our community.” Ultimately, residents believe a better image would discourage people from engaging in illicit activities.
A few other residents mentioned that their neighborhoods were safe and calm and that South Madison’s reputation of having a high crime rate was more a perception than reality. According to one respondent, “I heard the area had crime, but I haven't seen any yet.” Another shared that there is a “misconception of drugs and crime. People think it’s a bad place, and residents don't care.”
B. Physical aspects
1. Accessibility to neighborhood amenities and work
The neighborhoods’ location, its accessibility to local and citywide amenities and employment, was a key reason that homeowners and tenants moved and stayed.
Neighborhood Amenities: Residents liked that amenities were close by and “everything is in walking distance.” They also appreciated that the neighborhoods were centrally located, close to downtown and to other parts of the City. As one resident mentioned “great location, convenience to everywhere.” Neighborhood amenities included resources and services such as churches, schools, library, bike paths, parks, restaurants, and shops.
More homeowners and tenants in Bram’s Addition (36%) mentioned that they liked the accessibility to neighborhood amenities than homeowners and tenants in Burr Oaks (28%). As one homeowner commented, “it's accessible for bikes and buses, there is a community garden, for kids there are parks, and the library is within walking distance.” The research team found the difference in neighborhood response to be an interesting finding and given their similarity in distance to other areas of greater Madison, they wondered if it had to do with the amenities specific to each neighborhood. Though residents of different cultural and racial backgrounds mentioned liking the accessibility to neighborhood amenities, it was mentioned more by Whites (41%) than by those of other cultural and racial backgrounds combined (25%).
Some residents mentioned the need for more public spaces, businesses, and services. For example, though some residents liked their neighborhoods because there were places for kids to play, other residents said that there were not enough activities for youth. Residents expressed that the area needed to have more organized activities and places for kids to go, such as a neighborhood center that can offer youth programs, exercise classes, and community gathering spaces. A few residents mentioned that more shops of a specific type would be helpful. One person said, “there is everything I need, but a big grocery store.” Also, a person mentioned that smaller businesses close by, such as a coffee shop, could encourage people to spend more time together and “eat, play, and buy things.”
Work: Location is important in terms of neighborhood amenities, but also in terms of commuting distance to work. More than 60% of residents said that it took them 15 minutes or less to get to work (Figure 2.1). Several residents commented that they moved to the neighborhoods or continued living in the area because they wanted to be close to work.
An interesting finding was that even though public transportation is accessible on nearby Park Street, over 70% of respondents said that they used a car to commute to work (Figure 2.2). As shown in Table 2.1, this is similar to that found for Town and City of Madison residents. Some residents volunteered the importance of moving to or living in these neighborhoods because they could walk if needed or easily access the bike paths and bike to work. As stated by one resident, “I can walk to where needed or bike; things are close by.”
Figure 2.1: Commute time to work
Figure 2.2: Main mode of transportation used by residents
|
Table 2.1 Comparison
of commuting information for Bram’s Addition, Burr Oaks,
Town of Madison, and City of Madison* |
||||
|
|
Bram’s Addition |
Burr Oaks |
Town of Madison |
City of Madison |
|
Travel time to work less than 30 minutes |
84% |
78% |
79% |
85% |
|
Mode of Transportation -Car,
Truck, Van |
75% 7% 3% 11% |
82% 12% 2% 3% |
73% 17% 3% 3% |
68% 12% 0% 20% |
| * Information from 2000 census | ||||
Community members believed that not only is distance to work important, but also it is vital to create local employment opportunities. Some neighbors believed that a variety of employment opportunities that would be able to sustain a diverse workforce should be more easily accessible. A few residents mentioned that more small businesses would increase the number of jobs in the neighborhoods, which they felt were lacking.
2. Affordable housing
Residents stated that available housing that they can afford was an important reason they moved to these neighborhoods. This was stated more by homeowners (36%) than tenants (19%) and slightly more by residents in Burr Oaks (34%) than in Bram’s Addition (27%). Respondents, who had lived in the neighborhoods for less than 5 years, were more likely to mention that they moved here because of affordable housing than those who were here longer. The research team believed that one reason for this influx of people could be that Madison’s overall housing prices have increased dramatically in the past five years with South Madison remaining one of the few areas that people can still afford.
Residents said they moved here because of the cheaper rent, affordable homes, or the lack of income to move anywhere else. As stated by a few tenants, “[I moved here] because of the price of housing, low rent” and “I found a nice, inexpensive apartment.” A few residents stated that they were looking to buy a home and could not afford to buy anywhere else. As expressed by a few homeowners, “the property values are not as inflated [here]” and “I was looking to buy a house that’s affordable; this was my first house.”
Affordable housing is also a reason residents continue to live in these neighborhoods. Homeowners and tenants ability to afford and maintain their homes will be discussed in more detail in Chapters 3 and 4.
3. Physical maintenance and upkeep
After safety, a common response regarding what residents in Bram’s Addition (22%) and Burr Oaks (18%) neighborhoods did not like about their communities was the lack of physical maintenance and upkeep; this included private homes as well as public spaces. Examples of this include “the creek being smelly and dirty,” drainage problems in the street, some homes being in disrepair, and apartment managers not keeping their property well maintained. More on physical maintenance and upkeep of homes is discussed in Chapters 3 and 4.
Though tenants and homeowners reported that better upkeep of the neighborhood and physical improvements would make South Madison a better place to live, less than 10% of residents believed that it is a top issue facing the South Madison community that needs to be addressed.
This current section presents residents’ viewpoints on the positive attributes and challenges of their neighborhoods. The research team was also interested in understanding what residents’ viewpoints were regarding the revitalization efforts that are underway and how they believe it will eventually impact the community. The next section shares residents’ views about how these efforts will affect them and their neighborhoods.
|
Table 2.2 Characteristics residents liked about their neighborhoods (n =
109) |
||||
|
Neighborhood characteristics |
Homeowners |
Tenant |
Bram’s Addition |
Burr Oaks
|
|
Sense
of community |
53% |
54% |
56% |
50% |
|
Accessibility/amenities |
35% |
27% |
36% |
28% |
|
Diversity |
13% |
16% |
14% |
14% |
|
Personal/cultural
ties |
11% |
3% |
12% |
4% |
|
Affordable/adequate housing |
8%* |
0%* |
7% |
4% |
|
* Differences between column values are statistically significant at the p<.10 level using a Chi² test. |
||||
|
Table 2.3 Reasons residents moved in and stayed in their neighborhoods (n=109) |
||||
|
|
Why did you move here? |
Why do you continue living here?
|
||
|
Neighborhood
characteristics |
Homeowners |
Tenants |
Homeowners |
Tenants |
|
Sense
of community |
14% |
19% |
32% |
54% |
|
Accessibility/neighborhood amenities |
38% |
16% |
27% |
24% |
|
Affordable/adequate housing |
36% |
19% |
18% |
16% |
|
Personal/cultural
ties |
35% |
33% |
17% |
22% |
|
Diversity |
7% |
0% |
6% |
5% |
|
Table 2.4 Characteristics residents did not like about their neighborhoods (n =
109) |
||||
|
Neighborhood Characteristics |
Homeowners |
Tenants |
Bram’s Addition |
Burr Oaks
|
|
Community
relations |
18% |
16% |
25%* |
8%* |
|
Cost,
mix, type of housing |
10%* |
0%* |
5% |
8% |
|
Safety |
53% |
52% |
49% |
56% |
|
Lack of physical maintenance/upkeep (public space and private property) |
26% |
8% |
22% |
18% |
|
Lack and dislike of neighborhood amenities, resources, and businesses |
10% |
8% |
8% |
10% |
|
No
particular problems |
10% |
19% |
14% |
12% |
|
* Differences between column values are statistically significant at the p<.10 level using a Chi² test. |
||||
|
Table 2.5 Top issues faced by the South Madison community (n =
109) |
||||
|
Neighborhood characteristics |
Homeowners |
Tenants |
Bram’s Addition |
Burr Oaks
|
|
Community
relations |
16% |
19% |
22% |
12% |
|
Economic
development (i.e.
lack of employment and businesses) |
35%* |
19%* |
29% |
30% |
|
Safety/neighborhood disturbances |
53% |
62% |
58% |
54% |
|
Affordable/adequate housing |
13% |
8% |
12% |
10% |
|
Upkeep/maintenance |
6% |
5% |
3% |
8% |
|
*
Differences between column values are statistically significant
at the p<.10 level using a Chi² test. |
||||
III. Revitalization and its possible consequences
Revitalization works to increase community well-being through efforts that focus on land use, transportation, urban design, and economic and community development. There are several plans to improve the Park Street corridor and the surrounding neighborhoods that include restoring Wingra Creek, building a water spray park in the Burr Oaks neighborhood, and improving bicycle and pedestrian safety on Park Street. They also include the redevelopment of the Villager that is a currently a complex of health and social service providers with some retail. The Villager redevelopment includes retaining the health and social service providers, changing the mix of businesses and increasing retail, developing housing, creating a community gathering space, and expanding the current library.
Local residents are involved in the revitalization in numerous ways from planting perennials in the Park Street median to being active members of local efforts such as Park Street Partners. Park Street Partners is a collaboration among area residents, hospitals, businesses, governmental agencies, and the university dedicated to the economic and physical revitalization of the Park Street corridor.
The revitalization of Park Street and the South Madison neighborhoods has been an ongoing issue. The research team thought it was important to learn the community’s viewpoint on this redevelopment, most specifically how revitalization will affect the housing situation and the neighborhoods surrounding Park Street. The research team also wanted to investigate whether or not the outreach efforts to initiate understanding of and participation in the revitalization process have been successful.
Twenty-eight percent of homeowners and 63% of tenants stated they did not know about the revitalization or they had no response to the question “Do you know about the revitalization plans in South Madison?” (Table 2.6) There was also a significant difference between neighborhoods. Whereas 53% of Burr Oaks residents interviewed did not know about or they had no response to the revitalization question, only 29% of Bram’s Addition residents did not know about or they had no response. Whether or not residents’ knew about revitalization did not vary based on the length of time they had lived in South Madison.
Residents who believed that revitalization would be positive for the community believed that the revitalization efforts would attract more businesses and jobs to the area; thus, there will be more people spending money in the neighborhood. As one resident mentioned, “more money will be spent in the community, [could have a] second job closer to home.” A few people liked that revitalization may increase their property value or improve South Madison’s image. As said by one resident, who was optimistic about revitalization, “…it is likely to raise the value of my house!”
Although residents believed there was a positive side to revitalization, there were also concerns about some possible negative consequences. There were residents who felt positive, but had some reservations. These residents believed that revitalization will increase the number of businesses, but it will also increase housing costs, including taxes and rent, making the neighborhoods less affordable. One resident said, “My hope is that the improvements to Park Street and Quann Park, etc. will make it a more comfortable place to live. I worry that housing costs will rise causing development that will eliminate the smaller homes.” Or as another respondent said, “better retail and business, but rent may become less affordable.”
The majority of those who felt negative about the impact of revitalization believed that housing costs would increase, thus, forcing people to leave the area. Many homeowners stated that “taxes would go up.” As expressed by one homeowner, “poor people will have to leave, where will they go?” This is of particular concern since one of the major reasons residents moved to and stay in the area is availability of affordable housing.
|
Table 2.6 Possible effects from revitalization (n =
109) |
||||
|
Possible Effects |
Homeowners** |
Tenants** |
Bram’s Addition |
Burr Oaks
|
|
Positive |
31% |
20% |
32% |
21% |
|
Positive with reservations |
18% |
3% |
11% |
15% |
|
Negative |
16% |
6% |
18% |
6% |
|
No effects |
7% |
9% |
11% |
4% |
|
Don’t know about revitalization or possible effects (or no response) |
28% |
63% |
29% |
53% |
| **The differences between homeowners and tenants are statistically significant at the p<.05 level using a Chi² test. | ||||
In summary, the positive views of revitalization include development of businesses, more employment opportunities, improved image of the neighborhoods, higher property values, and better public amenities. The negative views focused on the increase in housing prices and taxes that may drive some residents, especially low-income and the elderly, out of the neighborhoods. These tensions reflect outcomes that have occurred in other parts of the country where revitalization has happened. To enhance the positive outcomes and minimize the possible negative consequences from revitalization, this tension needs to be considered and addressed.
IV. Suggestions for the neighborhoods
Bram’s Addition and Burr Oaks neighborhoods include qualities that Jane Jacobs (1961), New Urbanists, and many others believe contribute to the production of good and livable communities. These qualities, which are also found in the study area, include different types of housing (price, size, layout, ownership), a multi-use area (residential as well as retail), human scaled streets (short blocks in the neighborhood with sidewalks), and nearby amenities and public spaces (stores, restaurants, social services, and parks).
When the community residents answered questions about their neighborhoods, they weren’t thinking about Jane Jacobs or the principles of urban planning; they were sharing their own personal reasons for liking their neighborhoods. Residents stated that the qualities they appreciate about their neighborhoods are sense of community and good neighbors, shared personal and cultural background and diversity, access to neighborhood amenities and work, and affordable housing.
Residents had many wonderful comments about their community, but they also had concerns that need to be addressed to improve the livability of the area. The following suggestions arose during resident’ interviews and are from the research team’s findings. Their purpose is to support and enhance the positive attributes of the neighborhoods, while addressing the challenges that are negatively impacting the area.
For additional information regarding community viewpoints in the Burr Oaks and Bram’s Additions neighborhoods, it would be beneficial to also review South Madison Anti-Drug Coalition’s report titled Community Climate Assessment (2004).
Improve community relations
Sponsor more activities that increase communication and build relationships.
Many residents wanted to increase communication and build relationships with their neighbors. They believed this could increase respect and reduce prejudice, but also the increase in community presence could decrease illicit activity. Activities could include community suppers, block parties or festivals, and increasing resident involvement in decisions that affect their neighborhoods. One idea was to strengthen the neighborhood associations so that they are in a better position to bring residents together and sponsor more neighborhood activities. The inclusion of pictures and stories from the events could be shared in the broader Madison media to give others the opportunity to experience the positive qualities of South Madison.
Build shared leadership and collective ownership of public issues. Create conditions where local residents of all ages and backgrounds can see their own role and personal and social value in participating in the betterment of the community. Together they develop shared leadership and ownership of community problems and solutions.
Increase opportunities for leaders from different backgrounds to connect with each other, network, and build collaborations. Organizations and community groups outside South Madison could also be a tremendous resource; for example, East Isthmus Neighborhood Planning Council had a workshop where people from around Madison exchanged ideas and networked regarding their newsletters. Existing programs should be utilized to build and nurture leadership ability in individuals and teach skills. There are many training programs offered by different organizations throughout Madison (e.g. Grassroots Leadership College, Community Organizing and Family Issues). Existing leadership models and skill training programs throughout the country should also be reviewed and relationships should be built to continually enhance what is happening in Madison.
Increase safety
Improve communication and collaboration between police officers and residents. Community residents mentioned wanting to increase collaboration and understanding between police and neighbors so they can work together to solve problems. This request from the neighbors fits well with the concepts in the Problem-Oriented Policing model that is being promoted by the Bram’s Addition and Burr Oaks Neighborhood Officers to build community and increase safety. Problem-Oriented Policing “…places a high value on new responses that are preventive in nature, that are not dependent on the use of the criminal justice system, and that engage other public agencies, the community and the private sector when their involvement has the potential for significantly contributing to the reduction of the problem.”41
Currently, steps have been taken towards building these bridges. South Madison neighborhood organizations have planned community tours of the 9-1-1 emergency call center where local residents can learn about the center and educate the police and dispatchers about their concerns. The program should be reviewed to see how the lessons learned can be shared on a broader basis and if more tours should be held.
Increase pedestrian safety. Residents believe that cars drive too fast through neighborhood streets and are endangering children. One suggestion to increase pedestrian safety was to place speed bumps on the street to slow traffic; however, this is not always effective. Another option would be for local groups to work with the Safe Community Coalition of Madison and Dane County to learn about their programs and how they have worked with neighborhood groups to increase pedestrian safety.
Improve South Madison’s image. Residents believed that improving South Madison’s image is useful in building connections among community members and it may also discourage people from illicit activities, such as drug dealing. There should be an increase in positive coverage in Madison media regarding the people, organizations, development, and happenings in the community. South Madison media (e.g. Southern Exposure, neighborhood newsletters) should continue their work and find ways to connect with each other and build collaboration. Madison Commons, a program that teaches community members journalism skills, should be utilized by local residents with articles being posted on the website and used in other media venues.
Increase amenities and economic development
Assess neighborhood programs and resources. Residents stated that programs were lacking for youth, seniors, and immigrants. In addition, they also stressed the importance of a learning facility for adults and seniors. To effectively implement this concern, there should be an assessment of the neighborhood programs, resources, and services already in the area to evaluate what is missing, what needs to be changed, what requires more publicity, and what should be integrated. Before an assessment of this magnitude is undertaken, current resource surveys should be compiled and made available so as not to duplicate previous work (e.g. Madison Area Technical College survey, survey on work force housing).
Increase number and variety of employment opportunities available in the area to support the diverse workforce. According to community residents, this includes developing larger operations and encouraging local small and diverse businesses (e.g. family restaurant, coffee shop, grocery store). These businesses would be diverse in product or service offered, but also in ownership and employment opportunities. Residents believed that more local businesses would allow residents to walk to shops, increase job opportunities, and improve community relations by having places people could gather.
Improve physical maintenance and upkeep
Assess and increase use of current information and programs. Community members were concerned about the physical appearance of private homes as well as public spaces. There should be an assessment and compilation of current information regarding who to contact in specific situations and what are the standards and regulations. Programs offering home repair assistance should be compiled and connected with a South Madison liaison that connects residents with programs. For example, Project Home’s Hammer with a Heart brings together volunteers from the community to assist homeowners who are low-income with their necessary repairs. All of this information should be made accessible through a website, neighborhood newsletters, and binders located at the South Madison Branch Library and other locations. Another way to improve the condition of the neighborhood, which will also build relationships, is to have more resident planned and implemented local clean-ups, such as the existing Earth Day clean-ups.
Increase knowledge and involvement in revitalization plans
Improve outreach and engagement regarding revitalization. Specifics regarding the revitalization of Park Street were not known by the whole community, especially tenants. Outreach and a community feedback process need to be designed and implemented so they engage the different members of this diverse community. Relationships should be built with community leaders who can motivate others to participate and share with planners and organizers the most effective methods to increase involvement.
As shown in the findings, residents expressed advantages as well as disadvantages to revitalization and believe this tension needs to be addressed to ascertain the best outcome for the community. Park Street Partners should continue its work of being a steward of the Park Street vision and look to increase its connections to the South Madison community.
Ensure quality housing that is affordable in the community
Ensure that quality and affordable housing is available in South Madison. Being able to afford the purchase of a home or rent was a major reason respondents moved to the area and is an essential aspect of a healthy living situation. As stated in Chapter 1, a housing unit is defined as affordable if it costs no more than 30% of an individual’s or household’s gross income.42 However, this definition does not include repairs and maintenance for homeowners that can be very costly and make a current housing situation no longer part of a sustainable budget.
It is vital that land and housing acquisitions are implemented soon before prices increase to the point of not being fiscally permissible for non-profits and others to preserve existing, rehabilitate substandard, and create opportunities for different types of affordable housing in South Madison. There should be an organization that coordinates the affordable housing situation in South Madison. They would ensure that an overall vision is designed and implemented, while coordinating the various stakeholders. In addition, a university student could do research on innovative projects taking place throughout the community where affordable housing plays an important role in mixed-income neighborhoods.
It is also important that those working on the affordable housing issue in South Madison connect with other organizations focusing on this topic. Such involvement could help ensure that there is quality housing for individuals who are low-income in South Madison, but also that affordable housing is distributed throughout the larger Madison community. The ability for homeowners and tenants to afford their specific house will be discussed in Chapters 3 and 4, respectively.
Chapter 3: Homeowners
This chapter shares information regarding homeowners’ general living situation, home buying process, home maintenance, advantages and disadvantages of ownership, and suggestions for improvement. Of the 72 homeowners interviewed, 41 were from the Bram’s Addition neighborhood and 31 were from the Burr Oaks neighborhood. The information on the tenants in these neighborhoods is presented in Chapter 4.43
A. South Madison roots
Though homeowners have lived in South Madison for a variety of years, more than half have lived in South Madison for over 11 years (Table 1.2). One long time resident, who had lived in the neighborhood for over 30 years and had raised his family there, invited the research team members to sit on his stoop. It was a pleasant summer evening – not too hot and not too humid. Passers-by, both old and young, waved and honked their horns at our interviewee. Without even asking, it was clear that this resident had roots in this neighborhood and had been living there for many years. He described some of his neighbors – most had been his neighbors for over 20 years. Even though new people are always moving into the neighborhood, there are many residents like this homeowner who have established roots. When the research team asked homeowners how long they have owned their current home, as many as 40% had owned their homes for more than 11 years (Figure 3.1).
All homeowners, no matter how many years they had already lived in the area, shared that stability was important to them. Homeowners were asked, “How long do you plan to live in your home?” Almost two-thirds (62%) commented that they were planning to be in their home for the long-term (more than 6 years), 20% said the medium-term (between 2 and 6 years), and only 9% expected to be there for the short-term (less than 2 years) (Figure 3.2). Many who said they planned on living in their home for the long-term said they expected to be in their home “forever” or had no intentions of moving.
Figure 3.1: Length of time homeowners have owned their homes
Furthermore,
those who expected to be there for the long-term represented
homeowners who had lived in their home for different periods of time.
One would expect that the longer a homeowner lives in their home,
the more committed they are to staying in their home for the
long-term. However, the data reveals that homeowners who had lived
in their homes for more than one year expressed the same level of
commitment to staying in their homes for the long-term. For example,
those living in their homes between 1 to 4 years expressed the same
level of commitment as those living in their homes between 11 to 20
years.44
Residents’ level of commitment greatly increased for those who
have lived in their homes for more than one year.
Figure 3.2: Time planning to live in their homes
B. Homeowners’ living situation
A homeowner’s living situation includes information about the physical space (number of bedrooms), household composition, and their housing costs.
Physical space
Only a few homeowners (3%) lived in a 1 bedroom residence. The majority of homeowners lived in dwellings that had 2 or more bedrooms. Twenty five percent of homeowners lived in 2 bedroom homes, while nearly 40% lived in 3 bedrooms homes. The remaining third of homeowners lived in homes of more than 3 bedrooms.
Household composition
Some
homeowners lived by themselves, while others shared their households
with family members, friends, and others (Table 3.1). Most commonly,
homeowners had households of either 2 to 3 people or 4 to 5 people.
Nearly 20% of homeowners lived alone (see Chapter 4 for more
information on tenants).
|
Table 3.1 Number
of household members by
homeowners and tenants |
||
|
|
Homeowners |
Tenants |
|
1 person |
19% |
9% |
|
2 to 3 persons |
40% |
55% |
|
4 to 5 persons |
35% |
21% |
|
6 or more persons |
6% |
15% |
The
living situation of homeowners’ varied by race and ethnicity
(Table 3.2). Though there was some slight variation between Whites
and African Americans,45
the two groups were more similar to each other than to the
Hispanics/Latinos and Asians. Therefore, the four racial and ethnic
categories were clustered into two groups: 1) Whites and African
Americans, and 2) Latinos/Hispanics and Asians. The two groups
varied significantly.46
Some Whites and African-Americans resided alone, whereas no
Latinos/Hispanics or Asians did. Latinos/Hispanics and Asians were
more likely to live in larger sized households. Whereas the majority
(80%) of Latinos/Hispanics and Asians lived in 4 to 5 person
households, only 22% of Whites and African Americans did.
|
Table 3.2 Number
of homeowners’ household members clustered
by racial and ethnic categories |
||
|
|
Whites/ African
Americans** |
Latinos/Hispanics and Asians** |
|
1 person |
25% |
0% |
|
2 to 3 persons |
47% |
13% |
|
4 to 5 persons |
22% |
80% |
|
6 or more persons |
6% |
7% |
|
**Differences between Whites/African Americans and Latinos/Hispanics and Asians are statistically significant at the p<.05 level using a Chi² test. |
||
3. Housing costs
Though the research team did not ask homeowners about the purchase price or the percentage of their income they spent on housing costs initially, the research team did inquire about their current percentage of household income that went towards housing costs (i.e. mortgage, taxes, home insurance, and utilities). At the time of the interviews, 37% of homeowners spent about 30% or less of their income, 28% spent 31% to 50%, and another 28% spent more than 50% of their income on housing costs. Six percent did not know what their costs were relative to their income. According to these findings, at least 57% of homeowners were spending more than 30% of their income on housing costs and, thus, were not meeting the standard definition of owning an affordable home.
The amount of time a homeowner owned their home seemed to make somewhat of a difference. Though not statistically significant, 50% of homeowners who owned their homes for more than 11 years reported spending 30% or less of the income on housing costs, whereas 41% of homeowners who owned their homes for less than 11 years reported spending 50% or more of their income on housing costs. Due to a variety of circumstances, such as household income, maintenance costs, and taxes, the affordability of a unit can change over time for an individual household.
II. Home buying process
There are many aspects to the home buying process that can facilitate or hinder the road to ownership including a person’s financial situation, cost of a home, individuals or organizations assisting the homebuyer to find or afford a residence, and other unexpected situations. The following are some of the experiences Bram’s Addition and Burr Oaks homeowners’ had during this process.
A. Assistance and programs
Almost all homeowners (96%) mentioned receiving some form of support or assistance when buying their homes; however, the type of assistance and support received varied. Types of support and assistance included government or non-profit programs, businesses (e.g. real estate agents, bankers, mortgage companies), or personal acquaintances. These areas of support were not exclusive; individuals often received multiple forms of assistance in their purchase of a home. Thirty percent of homeowners mentioned accessing programs, mostly financial assistance, linked to government or non-profit organizations (Box 3.1). Twenty four percent of homeowners received support from real estate agents and 25% received assistance from bankers. Nineteen percent mentioned receiving assistance from family members and friends, who were themselves homeowners, which included receiving advice, financial assistance, a lead on a home, and inheritances.
In
a few instances, homeowners said that they relied only on themselves.
One person mentioned that they purchased their house in two
installments and without a mortgage, while another shared that they
had a large enough down payment in order to access a 15-year
mortgage.
|
Box 3.1 Examples of programs used by residents to purchase their home |
|
The demographic characteristics that were examined include homeowners’ gender, race and ethnicity, education, stress,47 age, and the number of years they have owned their homes (Table 3.3). The following are the noted differences that arose between groups in terms of accessing or utilizing assistance.
Neighborhood. More homeowners in Bram’s Addition accessed programs, such as financial assistance, than those in Burr Oaks.
Gender. Men were more likely to utilize the assistance of friends and family. More men mentioned using assistance from bankers, while more women used government and non-profit programs, such as financial assistance.
Race and Ethnicity. The data shows that more African Americans mentioned accessing and utilizing government and non-profit programs than the other racial and ethnic groups; Asians did not mention accessing or utilizing any programs to purchase their homes. Latinos mentioned using friends and family and bankers more than other groups.
Education. Homeowners with less than a college education mentioned utilizing friends and family and bankers more than those with some college or a college degree. Homeowners who attended some college or had a college degree were more likely to access government and non-profit programs, such as financial assistance, than homeowners without a college education.
Age. Homeowners under 30 years were more likely to mention receiving assistance from bankers than those over 30 years.
This information can
assist us in understanding who may or may not be accessing and
utilizing various types of assistance. This information can assist
government programs, non-profits organizations, financial
institutions, real estate agents, and other individuals offering home
buying assistance programs in targeting particular groups who may not
know or utilize programs but could benefit from home buying
assistance programs.
|
Table 3.3 Percentage
of each group utilizing different types
of home buying assistance
|
||||
|
Demographic categories (n=number of respondents)48 |
Friends/ family |
Real estate agent |
Banker49 |
Government and non-profit programs |
|
Neighborhood |
|
|
|
|
|
Bram’s Addition (n=41) |
27% |
32% |
37% |
54% |
|
Burr Oaks (n=31) |
32% |
42% |
32% |
35% |
|
Gender |
|
|
|
|
|
Female (n=36) |
19%** |
21% |
28% |
50% |
|
Male (n=34) |
41%** |
27% |
41% |
38% |
|
Race/Ethnicity |
|
|
|
|
|
White (n=33) |
33% |
42% |
30% |
42%** |
|
Black or African American (n=20) |
20% |
25% |
35% |
65%** |
|
Latino or Hispanic (n=5) |
40% |
40% |
60% |
40%** |
|
Asian (n=9) |
33% |
33% |
33% |
0%** |
|
Education |
|
|
|
|
|
Less than high school, some high school (n=14) |
36% |
29% |
36% |
29%50 |
|
GED, high school diploma (n=9) |
44% |
33% |
44% |
22% |
|
Some college, associate’s degree (n=17) |
18% |
41% |
29% |
65% |
|
Bachelor’s degree, post college (n=27) |
33% |
37% |
33% |
44% |
|
Stress |
|
|
|
|
|
about 30% or less (n=25) |
36% |
32% |
28% |
48% |
|
31% to 50% (n=19) |
21% |
37% |
37% |
47% |
|
More than 50% (n=19) |
26% |
37% |
42% |
42% |
|
Number of years owned home |
|
|
|
|
|
Less than a year (n=6) |
33% |
67% |
50% |
67% |
|
1 to 4 years (n=17) |
47% |
24% |
35% |
35% |
|
5 to 10 years (n=13) |
38% |
38% |
46% |
38% |
|
11 to 20 years (n=15) |
13% |
40% |
27% |
60% |
|
More than 20 years (n=9) |
33% |
33% |
22% |
33% |
|
Age |
|
|
|
|
|
18 to 29 (n=7) |
29% |
57% |
71%* |
29% |
|
30 to 49 (n=36) |
33% |
39% |
28%* |
47% |
|
50 to 70 or more (n=25) |
24% |
37% |
36%* |
44% |
|
*Differences between row values are statistically significant at the p<.1 level using a Chi² test. **Differences between row values are statistically significant at the p<.05 level using a Chi² test. |
||||
B. Home buying challenges
1. Process
Nineteen percent of homeowners mentioned facing some difficulties with the home buying process. The following were some of the difficulties experienced by homeowners that occurred at different steps of the home buying process.
Prior financial situation. Homeowners’ prior financial situation was a barrier to being able to buy a home. As one homeowner mentioned, “The process was hard: rebuilding credit and needing enough income to sustain home and family….We're low income, and we have health challenges. It was a challenge.”
Locating and accessing programs and lenders. A few homeowners mentioned having trouble finding information, resources, and/or accessing programs. “I tried to use affordable [housing] programs and other first homeowner programs, but the process was cumbersome. There was a lot of footwork; it was not very accessible or easily accessible.” Another homeowner commented on the difficulty of “finding a decent mortgage company.” In other circumstances, homeowners complained about the amount of paperwork. A few mentioned that they had used a certain program or lender because they had not known about other programs; if they had, they would have used them.
Misleading information. A few people who had successfully accessed programs or lenders complained about feeling misled later in the process. It is important to note that problems could be due to misleading information or a misunderstanding of the home buying process. For example, two homeowners said they felt cheated. One homeowner believed he “got misinformation and it [mortgage] cost me more than it should,” while another stated, “$3,000 was taken when we signed for the house.”
Unexpected problems. Some homeowners commented that they had unexpected problems that arose during the home buying process. One resident had a legal issue. Essentially, the tenants would not leave the residence that was being purchased, and the homeowner would not purchase the house until the renters vacated the property. In another case, a resident was using a program that advertised homeownership within 3 to 5 years, but the period of time was changed to 10 years when this prospective homebuyer was already a participant in the program. Finally, one respondent’s “mortgage lender went bankrupt” in the middle of the home buying process.
2. Discrimination
Of all the homeowners facing some difficulties (19%) while buying their homes, 44% of them mentioned facing some type of discrimination. Homeowners discussed both race and class-based discrimination.
A few people, African Americans and Whites, believed that the practice of red-lining (illegal practice of discriminating based on geographic location) was carried out by realtors. One owner, who was White, explained her experience when trying to buy a house in the neighborhood. “[A real estate company] said they don’t sell in South Madison because it is too dangerous. I called the police to ask about the situation. He stumbled through an answer – it was kind of a racist answer.”
Others perceived that because of their race, they did not have a choice in terms of where they chose to buy their home in Madison. An African-American homeowner explained, “They like to keep us on this side.” Another resident said, “I didn’t feel much choice in location.”
A few people commented on how they lacked control over the home buying process because of their low-income status. As expressed by one homeowner, “interest rates change while the programs are working with you on credit issues. The original interest rate increases or changes and to get it at a lower rate you have to wait for your score to reduce. If you're of low income, you don't have a lawyer or legal protection and unscrupulous activity takes place. They can change your contract in midstream.”
III. Home improvements
A. Types of home improvements
The majority of homeowners, 84%, made improvements to their residence. Some homeowners made some small changes such as repairing a window or painting a room, while others did major remodeling in the interior or exterior; one person purchased land and then built their home.
The research team did not ask for an exhaustive list of repairs, but asked for examples of the types of improvements that the homeowners have made to their homes. The research team did not differentiate whether they did the repairs themselves or had others do it (i.e. contractors). A list of the top examples of repairs and home improvements reported is as follows:
Interior work
33% did interior repairs and remodeling including fixing holes in the drywall, painting, building an addition, insulating, and building a new bathroom;
16% did electrical upgrading and rewiring, plumbing work, and updating appliances such as buying new furnaces, water heaters, and stoves;
11% installed new or repaired existing flooring; and
8% repaired or replaced windows and doors.
Exterior work
20% did exterior repairs and remodeling such as constructing a garage, building a porch, and installing new siding and gutters;
12% fixed or replaced roofs; and
12% landscaped yards including removing trees, adding sod, and planting flowers.
Men and women were just as likely to do interior as well as exterior work. However, the type of work reported varied by race. African-Americans were more likely than other groups to do interior work while Whites and Latinos/Hispanics were more likely to do exterior work. The homeowners’ responses were examples; therefore, the data might vary if the research team requested an exhaustive list of repairs and then asked why the homeowner chose to work on one aspect of their house instead of another.
B. Abilities and resources
Buying a home is a major expense and can be a hurdle towards homeownership. Once homes are purchased; however, they need to be maintained. For many homeowners, maintenance and repairs is one of the more difficult aspects of owning a home. First, homeowners stated that learning the skills and having the necessary motivation were factors affecting their ability to do repairs. As mentioned by one homeowner, “[it is] the motivation to do the maintenance.” Second, homeowners stated that it was difficult to find the time to do the repairs, and third, it was hard to budget the money to do current repairs and save for long-term repairs. As mentioned by a few homeowners, “[the most difficult things are] the cost and time.”
The research team asked homeowners their perceived level of difficulty regarding home maintenance in terms of time, skills, money needed to do current repairs, and budgeting for long-term repairs. In Table 3.4, the average has been calculated and reported for each demographic characteristic and for both neighborhoods. The averages range from 1, the least difficult, to 3, the most difficult. Therefore, an average of 2 signifies that the value is somewhere in the middle (i.e. somewhat difficult).
In general, the reported responses in terms of time, skills, money for current repairs, and budgeting for long term repairs was similar – mostly, people reported closer to the middle category (i.e. a little less than somewhat difficult). For the most part, there were few differences in terms of neighborhood and demographic characteristics. Average values for level of difficulty were similar for homeowners in the two neighborhoods, men and women, different racial and ethnic groups, residents who owned their home for different lengths of time, and respondents of different ages. Nevertheless, there were a few differences in the average values for people with different levels of education and people experiencing different levels of stress.
Time to keep up with repairs. Those with a GED or high school diploma experienced the least difficulty of all education groups.
Skills to do the repairs. Although the averages varied across the demographic and neighborhood groups, there were no large or significant differences between them.
|
Table 3.4 Level of difficulty with home repairs by group averages (n=
72) |
||||
|
Demographic characteristics |
Level
of difficulty by time 1= least difficult 2=somewhat difficult. 3=
most difficult |
Level
of difficulty by skills 1= least difficult 2=somewhat difficult 3=
most difficult |
Level
of difficulty by money 1= least difficult 2= somewhat difficult 3=
most difficult |
Level
of difficulty by budgeting 1= least difficult 2=somewhat difficult 3=
most difficult |
|
Neighborhood |
|
|
|
|
|
Bram’s Addition |
1.7 |
1.9 |
1.8 |
1.9 |
|
Burr Oaks |
1.6 |
1.7 |
1.7 |
1.8 |
|
Gender |
|
|
|
|
|
Female |
1.7 |
1.6 |
1.9 |
1.8 |
|
Male |
1.6 |
1.9 |
1.7 |
1.8 |
|
Race/Ethnicity (collapsed) |
|
|
|
|
|
White |
1.6 |
1.9 |
1.8 |
1.8 |
|
Combined Black/ African American, Latino/ Hispanic, and Asian |
1.7 |
1.7 |
1.7 |
1.9 |
|
Race/Ethnicity (by groups) |
|
|
|
|
|
White |
1.6 |
1.9 |
1.8 |
1.8 |
|
Black or African American |
1.8 |
1.8 |
1.7 |
2 |
|
Latino or Hispanic |
1.7 |
1.7 |
1.7 |
2 |
|
Asian |
1.6 |
1.3 |
1.7 |
1.7 |
|
Education |
|
|
|
|
|
Less than or some high school |
1.8 |
1.6 |
1.6 |
1.8 |
|
GED or high school diploma |
1.3 |
1.8 |
1.3 |
1.3 |
|
Some college or associate’s degree |
1.9 |
1.9 |
2.1 |
2 |
|
Bachelor’s degree or post college |
1.7 |
1.7 |
1.8 |
1.9 |
|
Stress |
|
|
|
|
|
About 30% or less |
1.6 |
1.7 |
1.4** |
1.5** |
|
31% to 50% |
1.7 |
2 |
1.8** |
2.1** |
|
More than 50% |
1.9 |
1.7 |
2** |
2.1** |
|
Number of years owned home |
|
|
|
|
|
Less than a year |
1.4 |
1.6 |
2.4 |
2.3 |
|
1 to 4 years |
1.8 |
1.7 |
1.6 |
1.7 |
|
5 to 10 years |
2 |
2 |
1.9 |
2 |
|
11 to 20 years |
1.6 |
2 |
1.6 |
1.5 |
|
More than 20 years |
1.4 |
1.4 |
1.4 |
1.7 |
|
Age |
|
|
|
|
|
18 to 29 |
1.5 |
1.4 |
1.6 |
1.8 |
|
30 to 49 |
1.8 |
1.8 |
1.9 |
1.9 |
|
50 to 70 or more |
1.5 |
1.8 |
1.6 |
1.7 |
|
**Differences between row values are statistically significant at the p<.05 level using a Chi² test. |
||||
Money to do current repairs. Homeowners with a higher level of education, some college or higher, reported more difficulties in terms of having the money available to do current repairs. This is surprising because as other research shows, education is associated with income – the higher the education, the more income people make, on average.51 Thus, one would expect that those with higher levels of education would have less difficulty in having the money to make repairs. On the other hand, as would be expected with stress level, the higher the percentage of household income paid for mortgage, taxes, insurance, and utilities, the more difficult it was for homeowners to pay for current repairs.
Budgeting for long-term repairs. A homeowner’s stress level also plays a role in long- term budgeting. Those who spent less than 30% of their monthly income on housing costs, reported less difficulty than that of those who spent more than 30% of their monthly income on housing costs. Homeowners with a GED or high school diploma reported experiencing a lower level of difficulty than the other groups similar to the above category.
It is interesting to note that homeowners with a GED or high school diploma have owned their homes longer than the other groups. This might serve as an explanation as to why there are unexpected findings based on a homeowner’s level of education and their level of difficulties in terms of having the time to make repairs, having money for current repairs, and budgeting for long-term repairs. Having owned their homes longer, they may have fewer housing costs such as lower mortgages or no mortgages at all.
C. Programs
The research team asked homeowners if they knew of or had used any programs (financial or otherwise) to help them fix or maintain their residences.52 The majority of homeowners (73%) did not know about or utilize any maintenance programs.
Twenty-seven percent of homeowners had knowledge of or used programs. The most commonly known and utilized program was Project Home; 60% of homeowners who knew of or used programs mentioned Project Home. Other programs known or used by homeowners to obtain the resources needed to fix or maintain their homes included WHEDA, City of Madison and Town of Madison home improvement loans, and borrowing from their bank (e.g. refinance or home equity).
There were differences
in terms of who knew about and utilized these programs (Table 3.5).
Women knew of and used these programs more than men. Homeowners with
some college education or an associate’s degree knew of and
utilized these programs more than homeowners with other education
levels. In addition, those who owned their home for less than a year
were more likely to know of and use these programs than homeowners
who had their homes for more than a year.
|
Table 3.5 Percentage of each group knowing of and utilizing programs to fix or maintain homes (n=72) |
|
|
Demographic characteristics
|
Percentage of total homeowners who answered yes |
|
Neighborhood |
|
|
Bram’s Addition (n=33) |
30% |
|
Burr Oaks (n=30) |
23% |
|
Gender |
|
|
Female (n=36) |
45%** |
|
Male (n=34) |
12%** |
|
Race/Ethnicity (collapsed) |
|
|
White (n=33) |
26% |
|
Combined Black/ African American, Latino/ Hispanic, and Asian (n=35) |
29% |
|
Race/Ethnicity (by group) |
|
|
White (n=33) |
26% |
|
Black or African American (n=20) |
41% |
|
Latino or Hispanic (n=5) |
0% |
|
Asian (n=9) |
11% |
|
Education |
|
|
Less than high school or some high school (n=15) |
15%** |
|
GED or high school diploma (n=8) |
29%** |
|
Some college or associate’s degree (n=17) |
56%** |
|
Bachelor’s degree or post college (n=27) |
17%** |
|
Stress |
|
|
About 30% or less (n=25) |
32% |
|
31% to 50% (n=19) |
16% |
|
More than 50% (n=19) |
35% |
|
Number of years owned home |
|
|
Less than a year (n=6) |
80%** |
|
1 to 4 years (n=17) |
7%** |
|
5 to 10 years (n=13) |
33%** |
|
11 to 20 years (n=15) |
46%** |
|
More than 20 years (n=9) |
11%** |
|
Age |
|
|
18 to 29 (n=7) |
17% |
|
30 to 49 (n=36) |
29% |
|
50 to 70 or more (n=25) |
26% |
|
**Differences between row values are
statistically significant at the p<.05 level using a Chi²
test. |
|
IV. Advantages
and disadvantages of homeownership
Homeowners
expressed many advantages to ownership; they have the freedom to make
decisions, earn equity, and feel a sense of establishment. On the
other hand, when the furnace breaks or the roof leaks, homeowners
cannot just call their landlords to come fix the problem for they
have the full responsibility of figuring out how to make the repairs
and paying for them. The following section shares community
residents’ perceptions of the joys and difficulties of
ownership.
A. Benefits of ownership
Homeowners enjoy many things about owning their particular home (Figure 3.3). The most common response mentioned by homeowners (49%) was the benefits and power of ownership. Benefits of ownership include financial ones such as building equity, not paying rent to someone else, and tax advantages. Another benefit of homeownership is a sense of belonging to the neighborhood. As said by one homeowner, “pride of ownership and feeling you have a stake in the community – feels like you put down roots.” Lastly, it is having the power and independence to make decisions about your residence ranging from who stays in your home to remodeling. One resident said that it means having discretion over “guests” and ultimately who and how many people can live in your home. Other residents mentioned the power of “making any changes desired” and “improvements at your own discretion,” such as planting and remodeling.
Figure 3.3: Benefits of ownership
The second most common response regarding what homeowners enjoyed about owning their residence was the physical space of the property (36%). Physical space pertained to the outdoors such as the “garden space” or the “back yard, large season porch,” as well as the indoors such as “lots of space in the house” and “space for entertaining and family can stay; my brother-in-law lived with us for two years.”
The next two most common responses had more to do with what homeowners liked about their neighborhoods, rather than their particular home. For example, 29% of homeowners expressed liking the sense of community, meaning having good feelings towards their community in terms of the general atmosphere and the people of their neighborhood. Twenty five percent of homeowners mentioned their homes’ location and their accessibility to neighborhood amenities as something they enjoyed (for more detail, see Chapter 2.II).
Finally, 19% of homeowners mentioned privacy as one of the top things they enjoy about owning their home. For instance, homeowners liked that they lived in a single standing residence rather than living in an apartment where they would have to share walls or floors with other residents.
B. Difficulties of ownership
When incorporating all the difficulties involved with homeownership, maintenance was more frequently mentioned (Figure 3.4). Almost half of homeowners (43%) mentioned that maintenance, upkeep and rehabilitation of their homes was the major difficulty they face.
Figure 3.4: Difficulties of ownership
Nineteen percent of homeowners commented that one of the top difficulties of ownership was having the money to pay mortgage, taxes, insurance, and monthly bills. As expressed by one homeowner, “the mortgage is high and taxes are high – I have to work harder.”
The next few responses had to do with the challenges of being a homeowner in Bram’s Addition and Burr Oaks neighborhoods rather than the difficulties they were facing in their own homes. For example, 15% of homeowners mentioned safety concerns and disturbances in the neighborhoods as one of their top difficulties and 13% percent of homeowners mentioned the lack of upkeep of public and community space (for more detail, see Chapter 2).
Finally, and related to the home buying process, about 10% of homeowners had other complaints ranging from how difficult it was to understand the paperwork to the sheer responsibilities of homeownership. Fourteen percent commented that they could not think of anything that was difficult about ownership.
The last section proposes suggestions that can improve the housing situation for homeowners, and those who want to be homeowners.
IV. Suggestions to improve the housing situation for present and future homeowners
Many homeowners had established roots in the South Madison community. More than half have lived in the South Madison area for over 11 years (Table 1.2) and as many as 40% of homeowners had owned their current residence for more than 11 years. Furthermore, most homeowners expected to live in their house for the long-term (more than 6 years) and lived in dwellings that had more than 2 bedrooms and resided in 2 to 3 or 4 to 5 person households. Their stability in the neighborhood brought them a familiarity with the community, but also a wealth of knowledge when it comes to the responsibilities, challenges, and benefits of homeownership.
When purchasing their homes, some residents had few challenges and received multiple forms of assistance that included advice from friends and family, support from real estate agents, and financial assistance from the government and non-profit programs. Some homeowners, however, faced major difficulties (e.g. locating and accessing programs and lenders, misleading information), including discrimination, during the process. After they purchased their residence, the responsibility of homeownership loomed large because they then had to maintain it, which in terms of skill, time, and cost was a major challenge. The ability to afford current repairs and budget for long-term repairs was especially difficult for some homeowners. Regarding assistance programs available for the purchase or maintenance of a home, some respondents were aware of and utilized specific programs, while others had no knowledge or were not able to access this support.
In addition to maintenance, residents expressed concern at being able to afford their homes in terms of the taxes they pay. Residents expressed concerns that taxes may continue to increase, if home prices in Madison continue to rise. Furthermore, residents were concerned that home prices and taxes may increase even more due to the revitalization in South Madison.
The following suggestions and recommendations are based on the experiences shared by the homeowners with the objective to make the home buying process and maintenance easier and more affordable for present and future homeowners.
Increase the accessibility of the home buying process and assistance programs
Develop and promote a clearinghouse for home buying materials. One challenge homeowners stated regarding the home buying process was accessing information. For example, one respondent shared that they would have utilized an existing program, but at the time of purchase the program’s existence was not known. This could be available in formats such as a website, printed materials, and information sessions.
One solution might be the implementation of a one-stop shopping website for home purchasers. A user-friendly, comprehensive website would assist residents in finding programs, lenders, and other support materials. This website could incorporate a checklist of all the necessary steps in order to purchase a home; allow for businesses, organizations, non-profits, and others to advertise their purchase programs, classes, and waiting lists; and explain discrimination in housing and possible recourse. Ideally, this website would be updated frequently and give easy to understand descriptions of programs, terms, eligibility, and contact information. Information would be in several languages (e.g. English, Spanish, Hmong). In order to make this accessible for those who don’t have a personal computer, several computers that have an easy link to the website could be located at public locations. The existence and use of the website would be advertised to people such as librarians and home buying seminar instructors. One website that has useful information, and could be expanded and built upon is the Home Buyers Round Table of Dane County at http://www.homebuyersroundtable.org.
Increase mentoring of homebuyers. Some homeowners mentioned being overwhelmed by the home buying process and that there are certain circumstances that can not be addressed adequately through written materials or a website and a mentor could be useful. Ideally, organizations already working with homebuyers could assist the buyer throughout the home buying process and serve as a liaison with other entities when problems or questions arise. After the purchase of their home, the buyer would maintain their relationship with their mentor to acquire assistance on financial issues, repairs, and more.
Assess current programs, assistance, and problems
Assess current home buying programs and first time home buying seminars for effectiveness and awareness in community. Assess current home buying programs on a number of factors such as ease of application, ratio of applicants to program participants, and effectiveness at working with the community they serve. This information can be used to improve programs and shared in the broader community so others can benefit from the lessons. This type of evaluation should also be considered for the different home buying seminars that are held in the community.
Assess what assistance is useful to homebuyers. In order to understand the type of assistance that homebuyers find useful, the City of Madison could request a simple survey that would ideally be completed at the closing. Homebuyers can be asked questions such the following. What assistance did you use? Was the assistance useful and easy to access? What problems did you encounter and how were these problems solved? This survey would ensure that everyone has the opportunity to share their opinions, but also the information can be used to improve the home buying process and assistance in Madison. To ensure full participation, this questionnaire should be available in several languages.
Increase residents’ knowledge on issues of housing rights to address discrimination. Homeowners mentioned facing both race- and class-based discrimination that affects whether people purchase a home and its location. Work being done by the Fair Housing Center of Greater Madison (satellite office of the Metropolitan Milwaukee Fair Housing Council53) should be promoted in the community through media outlets and other venues so people realize the problem, but also who they can contact if faced with discrimination.
Make home maintenance programs more accessible to homeowners
Assess effectiveness and increase outreach of home maintenance programs. The majority of homeowners did not know about or utilize home maintenance programs, but many claimed that home maintenance and repairs are the most difficult aspects of owning a home. Why are more people not aware of the programs or utilizing them? As with the home purchasing programs, there should be an assessment that covers such areas as ease of application, ratio of applicants to program participants, and effectiveness at reaching and working with the community they are to serve. This information can be used to improve programs and shared in the broader community so others can benefit from the lessons and partnerships can be built to address these issues.
Develop and promote a clearinghouse for home maintenance programs. In our study, most homeowners were not aware of financial and non-financial home improvement programs. Information on home maintenance programs could be available in various formats such as a website, printed materials, and information sessions.
For example, a user-friendly, comprehensive website could assist homeowners in learning about financial and non-financial home improvement programs. Ideally, this website would be updated frequently; give descriptions of programs and explain their terms, eligibility, and contact information; and appear in several languages (e.g. English, Spanish, Hmong). In order to make this accessible for those who do not have a computer, they could be set up at public places, such as the library, with an easily understandable link to the website. This website could be advertised to the public and others who provide housing assistance, including librarians. One website that has useful information on home purchasing that could be expanded and built upon to include home maintenance is the Home Buyers Round Table of Dane County at http://www.homebuyersroundtable.org.
Connect community members to home repair assistance. As shared in the suggestions for Chapter 2, programs offering home repair assistance should be compiled and a South Madison liaison would work to connect residents with these opportunities. For example, Project Home’s Hammer with a Heart brings together volunteers from the community to assist homeowners who are low-income with their necessary repairs.
Create more opportunities for skill acquisition
Create and make available classes that teach home repair skills. Though budgeting is an issue in terms of maintenance, some people mentioned not having the skills to do the necessary repairs. Classes can include installing insulation, sealing windows, painting, tiling, wall repair, flooring, and landscaping. Classes could be promoted through already existing organizations. For example, Home Depot already offers home repair classes and perhaps they can hold classes at a South Madison location.
Create more opportunities for local residents to share their skills with their neighbors. One way to learn skills and decrease the time necessary to complete a project is to invite your neighbors to assist, especially those community members who have the expertise in the area. For example, Dane County Neighbor-to-Neighbor Timebank is an existing program where community members exchange services. A home repair swap can be started as part of the Dane County Timebank.
Create a tool lending library. Homeowners may develop skills, but expensive tools may be a deterrent to home maintenance. A tool lending library could loan tools, offer classes, books and how-to videos to its members. The feasibility should be investigated including research on current programs of this type (website for the Temescal Tool Lending Library in Oakland, California is www.oaklandlibrary.org/Branches/temtll.htm).
Staying in the home for the long term
Assess property tax assistance program. Residents expressed concern that due to an increase in housing prices and higher assessments, they will not be able to afford to pay their property taxes. The current tax assistance programs for the City of Madison and Town of Madison should be evaluated for their effectiveness and innovative tax relief programs throughout the country should be compiled and examined for effectiveness.
Increase knowledge of weather proofing program that will lower utility costs. Madison Gas & Electric should continue their work at dispersing information regarding weatherizing a home, energy saving behaviors, and efficient appliances. It would also be useful to increase access and make services more affordable where individuals can assess their specific homes to discover the repairs that would be most effective for lowering energy bills and improving comfort. Project Home and other organizations should continue their work of doing energy saving repairs to families’ homes (e.g. installing insulation or energy efficient windows). Links to these organizations and information should be included in the clearinghouse for home maintenance programs. In addition, a South Madison liaison would work to connect residents with these opportunities.
Chapter 4: Tenants
This chapter presents information regarding tenants' general living situation, challenges with the rental process, maintenance and repairs of unit, relationship with landlord, and suggestions for improvement. 54 Of the 37 tenants interviewed, 18 were from the Bram's Addition neighborhood and 19 were from the Burr Oaks neighborhood.55 As mentioned in Chapter 1, tenants living in residences of more than 4 units were not included in this study; thus, the findings reflect tenants living in single-family units or structures with 4 units or fewer.56
I. Background on tenants
A. South Madison roots
As with homeowners, some tenants moved to these neighborhoods because they had a history with South Madison through having grown up in the community or had family and friends living in the neighborhoods and in other nearby locations. For example, 22% lived in South Madison 5 to 10 years, while another 22% resided in the area for 11 years or more. Even so, more than half (56%) of tenants were relative newcomers in that they had lived in South Madison for less than 5 years (Table 1.2).
Though 44% of tenants had a history of more than 5 years living within the South Madison neighborhoods, tenants did not have the same history with their current place of residence. The majority of tenants (84%) had lived in their present home for less than 4 years. The length of time tenants had rented their present home did not vary by neighborhood. A slightly higher percentage of tenants lived in single-family units (i.e. houses) longer than those residing in duplexes or three or four units (i.e. apartment).
B. Tenants’ living situation
A tenants’ living situation includes information about the physical space (i.e. type of housing, number of bedrooms), type of property owner, household composition, and housing costs.
1. Physical space
Tenants lived in a variety of dwellings. The type of housing that tenants lived in varied by neighborhood: 69% of respondents from Bram’s Addition lived in single-family units and 31% resided in duplexes or larger, whereas 29% of respondents from Burr Oaks lived in single-family units and 71% resided in duplexes or larger (Figure 4.1).
Similar to homeowners, only a few tenants (5%) lived in a 1 bedroom residence. The majority of tenants lived in dwellings that had 2 or more bedrooms. Forty one percent of tenants lived in 2 bedroom homes, 38% lived in 3 bedroom homes, and 16% lived in homes with more than 3 bedrooms.
Figure 4.1: Type of residence of tenants interviewed by neighborhood
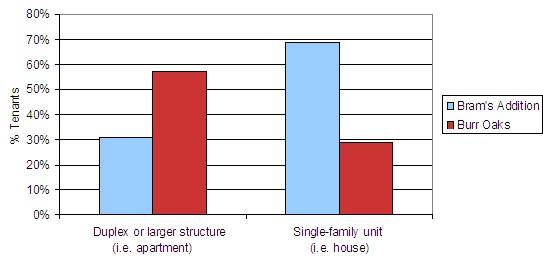
2. Type of property owner
Tenants rented from different types of property owners: 65% rented from private owners with whom they have no relation, 19% rented from family and friends, 8% from management companies, and 8% rented from other entities (e.g. Madison Community Cooperative, Community Development Authority).57 Only tenants living in single-family units had landlords who were friends and family. A higher percentage of tenants in Burr Oaks mentioned renting from friends and family than in Bram’s Addition.
3. Household composition
Though a few tenants lived by themselves, most shared their residence with family members, friends, and others (Table 3.1). Slightly over half (55%) of tenants had 2 to 3 people in their household. Twenty one percent of tenants had households with 4 to 5 people and 15% lived in households with 6 persons or more.
There
was a variation of number of people per household by race and
ethnicity (Table 4.1). Whites and African Americans responded
similarly compared to Hispanics/Latinos and Asians. Therefore, the
four racial and ethnic categories were clustered into two groups: 1)
Whites and African Americans, and 2) Latinos/Hispanics and Asians.
The two groups varied significantly.58
Whereas most Whites and African-Americans resided in 2 or 3 person
households, Latinos/Hispanics and Asians were more likely to live in
larger sized households of 4 persons or more.
|
Table 4.1 Number of tenants’ household members clustered by racial and ethnic categories
|
||
|
|
Whites/African
Americans** |
Latinos/Hispanics
and Asians** |
|
1 person |
8% |
0% |
|
2 to 3 persons |
65% |
0% |
|
4 to 5 persons |
17% |
40% |
|
6 or more persons |
9% |
60% |
|
**Differences between Whites/African Americans and Latinos/Hispanics and Asians are statistically significant at the p<.05 level using a Chi² test. |
||
4. Housing cost
As with homeowners, the research team asked tenants about their current percentage of household income that went towards their housing costs (i.e. rent and utilities).
At the time of the interviews, 44% of tenants spent about 30% or less of their income, 22% spent 31% to 50%, and another 33% spent more than 50% of their income on housing costs. According to these findings, at least 55% of tenants were spending more than 30% of their income on housing costs and, thus, were not meeting the standard definition of renting a unit that is considered affordable.
C. Challenges with the rental process
1. Affording rentals
Some tenants had a difficult time affording rent even in areas such as South Madison that historically have lower prices than other sections of Madison. In order to make housing more affordable, tenants sometimes used rental assistance. Only 15% of tenants reported that they received any special assistance to rent their home. Some of the programs they used were Section 8 vouchers,59 assistance from non-profit organizations, and Supplemental Security Income (SSI - federal income supplement program). Considering the small number of tenants receiving assistance, it was not possible to make comparisons using demographic characteristics or types of housing in which people lived.
2. Discrimination
Just as some homeowners experienced discrimination while trying to purchase their home, there were tenants who faced discrimination during the rental process. Seventeen percent of tenants reported encountering some form of discrimination when they tried renting in South Madison. The types of discrimination varied. A few tenants mentioned that the discrimination they faced was based on race. For example, one tenant said the landlord told him that he could not move to an apartment because of income; however, “I feel it was because my roommates are black.” A couple of tenants mentioned that it was due to their credit or employment history or lack of income. One other person believed that the housing she was living in was “opposed to family.”
II. Maintenance schedules and repairs
Analysis of the findings revealed that the landlords’ maintenance schedules and response time to complete repairs varied. Considering that a major benefit of renting is that landlords, rather than tenants, have the responsibility for maintenance, the timeliness in which repairs were completed was an important component in a renter’s overall perspective of their housing situation.
A. Maintenance schedules
Based on tenants’ responses, the research team found that landlords had different maintenance schedules. Fifty nine percent of landlords had a regular maintenance schedule and checked on their property weekly, monthly, or a few times a year, while 41% did not have a regular maintenance schedule. In the second situation, a landlord would usually come only in response to their tenant’s call.
Landlords
kept more of a routine maintenance schedule for apartments than
single-family units (Table 4.2). Seventy five percent of tenants
living in apartments reported that landlords had a routine
maintenance schedule, compared to 38% of those living in
single-family units. Interestingly, maintenance schedules were
different by neighborhood with landlords in Burr Oaks more likely to
have a regular maintenance schedule than those in Bram’s
Addition. A reason for this difference could be that more tenants
living in apartments were interviewed in Burr Oaks than in Bram’s
Addition. As previously stated, landlords are more likely to have a
routine maintenance schedule in apartments than single-family units;
thus, the difference could be associated with the type of housing
rather than only the neighborhood.
|
Table 4.2 Landlords’
maintenance schedules by type of housing and neighborhood |
||||
|
|
Tenants living in duplexes or larger (i.e. apartments)** |
Tenants living in single-family units (i.e. houses)** |
Bram’s Addition neighborhood** |
Burr Oaks neighborhood**
|
|
Routine schedule (weekly/monthly/a few times a year) |
75% |
38% |
31% |
83% |
|
No routine schedule
|
25% |
62%** |
69% |
17% |
|
TOTAL |
100% |
100% |
100% |
100% |
| **Differences between tenants living in apartments versus houses and tenants living in Bram’s Addition versus Burr Oaks are statistically significant at p<.05 level using a Chi² test. | ||||
B. Types of repairs and timeliness
To get an understanding of the types of repairs that tenants needed and the landlords corresponding response time, the research team asked residents to describe the last repair and how long it took the landlord to fix it.
The most common repair that tenants requested was plumbing. Almost half the tenants (46.6%) mentioned some type of plumbing problem, such as clogged drains and broken water heaters. Slightly more than a quarter of tenants mentioned other repairs such as electrical issues or lights (6.6%); problems with appliances (10%); and others such as roof, insulation, and floors (10%). Slightly more than a quarter of tenants (26.6%) mentioned that they had not yet requested or needed a repair.
Of tenants who requested a repair, landlords responded in the following ways:
- 42% responded between a few hours to less than a week, 23% responded between one week to one month, 16% took more than one month to respond, and 8% never responded.
- Twelve percent of the tenants said they did not remember or know their landlord’s response time (Figure 4.2). There was very little difference in terms of the type of repair (e.g. plumbing, appliances, etc.) needed and the response time of the landlords.
Figure 4.2: The length of time it took to do needed repairs
III. Tenant and landlord relations
Considering the importance of a landlord’s role in the upkeep of their building and that a tenant’s housing situation is linked to how well the property is maintained, research team members believed that it was important to learn about the landlord and tenant relationship.
More specifically, the research team was interested in frequency of communication, landlord’s response to special situations such as late rent, and other factors that affect a tenant’s perception of the relationship.
A. Frequency of communication
All tenants mentioned that they talked with their landlords, though the levels of communication differed. A majority of tenants (59%) reported communicating with their landlords more than once a month, 26% communicated every month, and 12% communicated every few months. Only 3% said they communicated with their landlord only once a year. The level of communication was similar across neighborhood and type of property owner and housing. Also, tenants’ communication level with their landlords did not differ across age, racial and ethnic groups, educational levels, or gender.
B. Dealing with special situations – late rent payment
During the meetings where the research team constructed the interview materials, they also discussed issues of concern. One of these issues was the response of the landlord in an unexpected situation; specifically, the research team was interested in learning whether landlords were willing to work with tenants regarding a late rent payment. This issue was particularly important for a few research members who had bad experiences with their landlords either because the tenants were unaware of the late payment policy or it was so strict that unanticipated problems could not be accommodated. Research team members were interested to learn the extent of this concern.
The majority of tenants (81%) knew about their late rent policies that included giving the landlord a call to say they will be late, paying an additional fee, and being evicted after 5 days of non-payment. Eighty six percent of tenants mentioned that landlords would work with them if they were late on a rent payment. Though this gives an idea of how landlords would deal with late payments for the majority of the tenants, it still is uncertain what would happen to the minority who were not aware of the policies or not certain of their landlord’s reaction if they were late with rent.
C. Quality of the relationship with the landlord
A tenant’s perspective on the landlord relationship can color their view of the broader housing situation. The research team asked tenants to rate the quality of the relationship they had with their landlords from very poor to excellent. The scores ranged from 1, very poor, to 5, excellent.
Forty one percent of tenants mentioned they had an excellent relationship with their landlord, 16% said very good, 35% said good, 0% said poor, and 8% said very poor. Though this is interesting information in itself, the research team also wanted to understand the factors that may be associated with a tenant’s positive or negative rating of the relationship with their landlord.
Table 4.3 presents some factors that may explain a tenant’s rating regarding the quality of relationship with their landlord. The second column of this table presents the average values (scores ranged from 1, very poor, to 5, excellent) for tenants’ ratings of their relationship with their landlord according to each of the factors in the left hand column. The following factors that may explain tenants’ ratings on the quality of their relationship include type of housing and property owner, frequency of communication, timeliness of repairs, and how landlords deal with special situations that arise, such as late rent.
Neighborhood and type of housing. The quality of the relationships with the landlords varied slightly by neighborhood with tenants’ rating their relationship slightly higher in Burr Oaks (4) than in Bram’s Addition (3.6). The quality of the relationships with the landlords was nearly the same for tenants living in apartments and single-family units.
Type of property owner. There is a small variation between the type of property owner and the quality of the relationship with the landlord. This quality of relationship was higher (4.3, very good to excellent) when friends or relatives were the property owners than compared to private owners with whom they had no relation (3.6, good to very good).60
Frequency of communication. Though there was some variation on how tenants rated their relationship with their landlord, there was not a clear pattern in terms of the frequency of communication and the quality of the relationship with the landlord.
Maintenance schedules and timeliness of repairs. The maintenance schedule the landlord had did not influence how tenants rated the quality of their relationship. Interestingly, the length of time it took to make repairs and whether tenants viewed them to be completed in a timely manner was significantly associated with the quality of the relationship with the landlord. As might be expected, the quality of the relationship with the landlord was higher the less time it took to do the repairs. If landlords completed repairs in less than a week, the quality of the relationship was a 4.3 (very good to excellent) as compared to a 3.3 (good to very good) if they took longer than a month to complete the repairs. More importantly, the landlord relationship was ranked a 1 (very poor) if tenants had requested a repair, but the landlords had not done them by the time the resident was interviewed by the research team in summer 2005.
No matter the actual time it took to do the repair, the quality of the relationship with the landlord was higher if the tenants perceived that their landlords made the repairs in a timely manner. The quality of the relationship was a 4.3 (very good to excellent) for landlords who had made timely repairs compared to 2.2 (poor to good) for those who had not made timely repairs.61
Dealing with special situations – late rent. There was a significant difference between how renters viewed their relationship with the landlords and whether they were willing to work with tenants if they were late on rent. The quality of the relationship with the landlord was a 4 (very good) if tenants felt their landlords were willing to work with them and a 2.3 (poor to good) if they were not. Also, tenants who did not know whether the landlord would work with them if they were late on rent rated their relationship as a 2 (poor).62
In
summary, there was significant variation in several of the factors
examined in Table 4.3. The most significant factors contributing to
tenants rating of the quality of their relationships with their
landlords was the time it took to complete repairs, whether the
length of time to complete repairs was perceived as timely, and if
the landlord would work with the tenant during special situations.
|
Table 4.3 Quality of the relationship with the landlord by averages
|
||
|
|
Quality of relationship with landlord very poor = 1, poor = 2, good = 3, very good = 4, excellent = 5 |
Level of satisfaction with condition of home not satisfied = 1, somewhat satisfied = 2, satisfied = 3 |
|
Neighborhood |
|
|
|
Bram’s Addition |
3.6 |
2.7 |
|
Burr Oaks |
4 |
2.6 |
|
Type of residence |
|
|
|
Apartment |
3.8 |
2.7 |
|
Single-family unit |
3.6 |
2.7 |
|
Type of property owner |
|
|
|
Friends or relatives |
4.3 |
2.6 |
|
Private owner (no relation) |
3.6 |
2.6 |
|
Management company |
5 |
2.7 |
|
Other entity, program |
3 |
3 |
|
Frequency of communication |
|
|
|
More than once a month |
4 |
2.7 |
|
Every month |
3.2 |
2.7 |
|
Every few months |
4 |
2.5 |
|
Once a year |
3 |
2 |
|
Never |
NR |
NR |
|
Regular maintenance schedule |
|
|
|
Routine schedule |
3.6 |
2.5 |
|
No routine schedule |
4 |
2.7 |
|
Length of time to do repair |
|
|
|
A few hours to less than a week |
4.3** |
2.8** |
|
One week to one month |
4** |
2.2** |
|
More than one month |
3.3** |
2.8** |
|
Requested but hasn’t happened |
1** |
2** |
|
Never requested a repair |
3.9** |
2.9** |
|
Fixed in a timely manner |
|
|
|
Yes |
4.3** |
2.9** |
|
No |
2.2** |
1.8** |
|
Haven’t needed a repair |
3.6** |
1.8** |
|
Landlord will work with late rent |
|
|
|
Yes |
4** |
2.7** |
|
No |
2.3** |
2.3** |
|
Don’t know |
2** |
1.5** |
|
NR = No responses **Differences between row values are statistically significant at the p < .05 level using a Chi² test. |
||
IV. Advantages and disadvantages of renting
A. Satisfaction with condition of home
Besides there being many conditions that may influence a tenant’s perception of their relationship with the landlord, there are numerous factors that can affect how satisfied a tenant is with the condition of their home. The second column of Table 4.3, presents the average values (scores ranged from 1, not satisfied, to 3, satisfied) representing tenants’ ratings of how satisfied they were with the condition of their home according to each of the factors in the left hand column.
The level of satisfaction varied slightly by neighborhood, type of residence and property owner, and whether the landlord had a regular maintenance schedule. Though not statistically significant, respondents reported a higher level of satisfaction if they had communication with their landlord more than once a year.
Tenants were more likely to feel a higher level of satisfaction with the condition of their home if their landlord made repairs when they were requested. Tenants ranked the level of satisfaction with the condition of their home lowest (2, somewhat satisfied) if they had requested a repair, but it had not been completed by the time the research team interviewed them.
Tenants stated a significantly higher level of satisfaction with the condition of their homes, if they perceived that needed repairs were completed in a timely fashion. Tenants rated the level of satisfaction with the condition of their home a 2.9 (out of a possible 3) when they perceived that repairs were made in a timely manner as compared to a 1.8 (closer to somewhat satisfied) if perceived as not timely. If the respondent had not yet needed or requested a repair, they rated their satisfaction level as a 1.8 (closer to somewhat satisfied).
Tenants were also more likely to have higher levels of satisfaction with the condition of their home when they believed that their landlord would work with them regarding late rent payments. The satisfaction rating was 2.7 (close to satisfied) if they believed their landlords would work with them as compared to a 2.3 (closer to somewhat satisfied) when they believed their landlords would not work with them. For tenants’ who did not know whether their landlords would work with them if they were late with rent, the rating was 1.5 (between not satisfied and somewhat satisfied).
B. Benefits of renting
Tenants were asked, “Can you tell me the top things you enjoy about renting this home?” They listed qualities pertaining to their home as well as their neighborhood (Figure 4.3).
Beginning with the qualities they liked about renting their particular home, 43% reported that they enjoyed the physical space or layout of their home. Several people mentioned “the big back yard” as a positive attribute. Others mentioned the basic layout of the house: “there is more room for my kids and family” or “big house and the bar in the basement.”
Nearly a quarter (24%) of tenants mentioned rental benefits and one of these benefits was mobility. As one tenant commented, “I can move anytime.” Another benefit was not being responsible for repairs. As mentioned by one tenant, “I have no maintenance, and I enjoy it because it is kind of like [owning] a house: advantages of a home, but without the maintenance.”
Eleven percent of tenants said they enjoyed having a good and nice landlord. Another 8% of tenants commented that what they enjoyed most was the freedom to make some decisions about their living space. As expressed by a few tenants,
“I have the freedom to fix things and do things.”
“I do anything I want; I feel like I own.”
“I can play music very loud!”
This freedom to make decisions closely reflects what homeowners enjoyed about owning their homes, namely, the power to make decisions over their living space.
Though the question asked what tenants enjoyed about renting their particular home, many also mentioned things about the neighborhood. Thirty two percent of tenants stated that they enjoyed a sense of community, which means having positive feelings in terms of the general atmosphere and the people of the community, and 13% of tenants mentioned the location or accessibility to amenities (for more details, see Chapter 2. II).
Figure 4.3: Benefits of renting
C. Difficulties of renting
Tenants were also asked, “Can you tell me the most difficult things you face about renting this home?” Tenants discussed the problems of renting their specific home, but also mentioned some difficulties regarding their neighborhood (Figure 4.4).
In terms of their homes, 22% of tenants mentioned the physical space or layout of their homes; mainly, they were too small. Another 22% mentioned the upkeep or maintenance of their homes or their neighborhoods in general. For example, some problems expressed by tenants regarding their home were maintenance issues (e.g. landlord not getting repairs done) or issues with heating such as a lack of insulation in the house or difficulty regulating the heat on two floors. A few people mentioned the upkeep of the neighborhood (for more details, see Chapter 2. II).
Regarding their community, the main issue mentioned (19%) was being concerned about some of the neighbors, who were at times noisy and disruptive. This also included being concerned about people passing through the neighborhoods who could also be noisy, park in front of their driveways, or throw litter (for more details, see Chapter 2. II).
Eleven percent of tenants mentioned that the problem was simply being a renter rather than a homeowner since they were not entitled to the ownership benefit of earning equity. Another 11% mentioned the cost of the rent or utility bills. One person mentioned that rent was high considering that the landlord “doesn’t take care of it.” Nineteen percent of respondents said they did not have any difficulties with renting their home.
Figure 4.4: Difficulties of Renting
V. Tenants’ perceptions and experiences with home buying
The research team was interested in trying to understand whether tenants had considered buying a home, and the type of obstacles they may have faced. One research team member expressed that she had been trying to purchase a house for years and was caught between not making enough income to afford the mortgage and related expenses, but was earning too much to qualify for home buying programs. Some research team members shared that given their income level they would never be able to afford a home, while others stated that they had achieved ownership mainly through the assistance of programs. In this section, tenants’ demographic characteristics and the neighborhoods in which they reside are examined to better understand which tenants had considered home buying and knew about assistance programs. An examination of what types of tenants had considered buying a home and knew of the programs can allow organizations to recognize underserved populations and work to assist a more diverse population.
A. Considered buying a home
Three quarters of the tenants interviewed (76%) expressed that they had at some point considered the purchase of a home. In order to get a better understanding of which tenants had considered buying a home, the neighborhood and their demographics were examined in relation to whether they had ever considered buying a home (Table 4.4). The factors examined include neighborhood, type of current housing, gender, race and ethnicity, education, stress,63 and age. The following are the noted differences that arose between groups in terms of whether they considered purchasing a home.
Neighborhood. A slightly higher percentage of tenants in Bram’s Addition considered buying a home than in Burr Oaks.
Type of housing. A slightly higher percentage of tenants living in single-family units had considered buying a home as compared to those living in an apartment.
Gender. There was a very small difference between men and women and whether they had considered buying a home.
Race and ethnicity. Although African Americans had considered home buying slightly less than Whites, the percentages of African American and Whites were more similar to each other than to Hispanic/Latinos and Asians. Therefore, the four racial and ethnic categories were clustered into two groups: 1) Whites and African Americans, and 2) Latinos/Hispanics and Asians. The two groups varied significantly.64 Whites and African Americans were more likely to have considered home buying than Latinos/Hispanics and Asians.
Education. There was some variation in terms of tenants’ educational levels; however, the pattern was not clear. One clearer variation was that tenants in the group with the highest level of education had considered purchasing a home more often than those in the group with the lowest level of education.
Stress. Those who paid 30% or less of their household income towards rent and utilities had considered buying a home less than the other two categories.
Age. Those aged 30 to 49 considered purchasing a home less than the other two groups.
In summary, there was some variation in several of the factors examined in Table 4.4. The most significant one that contributed to whether tenants had considered buying a home was race and ethnicity.
B. Financial obstacles and knowledge of home buying programs
Of all the tenants who had considered buying a home, 85% faced financial obstacles. The main financial issue was insufficient income – whether it was lack of a down payment, problems accessing financing, or an unstable job. As mentioned by a few tenants, “I had a hard time getting a down payment” and “[it’s my] finances, I have a few loans to pay down.” Past or present credit problems were another financial issue expressed by tenants. A common response was stated by this tenant, “I can’t do it financially because of my [credit] history.” A few other people mentioned the lack of a credit history, “I can’t afford it; I have to establish a good record.”
The remaining 15% faced other obstacles including high housing prices in the local neighborhoods and in Madison and not wanting the responsibilities that accompany owning a home (e.g. maintenance and repairs). One tenant mentioned that a legal issue was preventing her from buying a particular house, and another mentioned a lack of information regarding home buying programs. A few people said that they just were not interested in owning a home.
After
asking respondents what obstacles they were facing in their purchase
of a home, the research team asked the tenants if they knew of any
programs (financial or otherwise) that could help them buy a home.
Slightly more than half the tenants (56%) knew of some type of home
buying program (Box 4.1).
|
Box 4.1 Examples of home buying programs shared by tenants |
|
Just as tenants’ neighborhood and demographics were examined in relation to whether they considered purchasing a home, the same analysis was applied to their knowledge of home buying programs (Table 4.4). The following are the noted differences that arose between groups in terms of whether they knew of any home buying programs.
Neighborhood. A significantly higher percentage of tenants in Bram’s Addition knew of home buying programs compared to Burr Oaks.65
Type of housing. A significantly higher percentage of tenants living in single-family units knew about home buying programs compared to those living in apartments.
Gender. A significantly higher percentage of women knew about home buying programs compared to men.
Race and Ethnicity. When examined by all race and ethnic groups, the percentage of African Americans and Whites who knew about home buying programs were more similar to each other than to Latinos/Hispanics and Asians; thus, the four racial and ethnic categories were clustered into two groups: 1) Whites and African Americans, and 2) Latinos/Hispanics and Asians. The two groups varied significantly.66 Whites and African Americans were more likely to know of home buying programs than Latinos/Hispanics and Asians. In the small sample, no tenants in the latter group were aware of any home buying programs.
Education. There was variation in terms of tenants’ educational levels and whether they knew of home buying programs. Tenants who had some college or more education had a greater likelihood of knowing about home buying programs than those who had a GED, high school diploma, or less education.
Stress. There was a little difference between tenants’ stress levels (percentage of monthly income that is used towards rent and utilities) and whether they had considered buying a home.
Age. There was some variation between age groups. Fewer tenants between 18 to 29 years reported knowing about home buying programs than tenants over age 30.
In
summary, the most significant factors that contributed to whether
tenants knew of home buying programs were the neighborhoods, type of
current housing, gender, and race and ethnicity. Education was also
an important factor.
|
Table 4.4 Percentage
of tenants who had considered home buying and
knew of assistance programs by neighborhood and demographic
characteristics |
||
|
|
Had considered home buying |
Knew of home buying programs |
|
Neighborhood |
|
|
|
Bram’s Addition (n=18) |
83% |
63%** |
|
Burr Oaks (n=19) |
68% |
28%** |
|
Type of Housing |
|
|
|
Apartment (n=13) |
77% |
25%** |
|
Single-family unit (n=15) |
93% |
64%** |
|
Gender: |
|
|
|
Female (n=26) |
77% |
54%* |
|
Male (n=11) |
73% |
20%* |
|
Race/Ethnicity (by two groups) |
|
|
|
White and African American (n=26) |
85%* |
50%** |
|
Latino or Hispanic and Asian (n=6) |
50%* |
0%** |
|
Education |
|
|
|
Less than high school or some high school (n=5) |
60% |
40%67 |
|
GED or high school diploma (n=12) |
83% |
18% |
|
Some college or associate’s degree (n=13) |
62% |
64% |
|
Bachelor’s degree or post college (n=7) |
100% |
57% |
|
Stress |
|
|
|
About 30% or less (n=16) |
69% |
40% |
|
31% to 50% (n=8) |
88% |
63% |
|
More than 50% (n=12) |
83% |
40% |
|
Age |
|
|
|
18 to 29 (n=16) |
75% |
27% |
|
30 to 49 (n=10) |
60% |
67% |
|
50 to 70 or more (n=11) |
91% |
50% |
|
*Differences between row values are statistically significant at the p<.1 level using a Chi² test. **Differences between row values are statistically significant at the p<.05 level using a Chi² test. |
||
The last section in this chapter presents suggestions and recommendations on how to improve tenants’ personal living conditions and make home buying more accessible to those who are interested.
VI. Suggestions to improve the housing situation for present and future tenants
Though 44% of tenants interviewed for this study had a history of more than 5 years living within the South Madison neighborhoods, tenants did not have the same history with their current place of residence. The majority of tenants (84%) had lived in their present home for less than 4 years. The type of residence tenants lived in varied by neighborhood. In Bram’s Addition more respondents resided in single-unit residences (i.e. houses), whereas in Burr Oaks most of the tenants lived in duplexes or larger complexes (i.e. apartments). The majority of respondents lived in dwellings with 2 or more bedrooms and resided in 2 to 5 person households. Tenants’ housing and living situation were affected by a number of factors, most importantly, their homes’ physical condition and relationships with landlords and neighbors.
Landlords are responsible for the maintenance and upkeep of the tenants’ homes. In general, landlords had a more routine maintenance schedule for apartments than single-unit residences. Tenants requested a variety of repairs that included plumbing, electrical, and appliances. In evaluating their overall living situations, tenants were less affected by the types of repairs than the time it took for landlords to respond to their requests. The majority of landlords completed repairs in less than a month (almost half of the landlords made the repairs in less than a week), but some landlords never responded to tenants’ requests. Tenants rated the quality of their relationships with their landlords higher the less time it took to do repairs, and if tenants perceived the repairs were completed in a timely manner. In addition, tenants also rated the relationships higher if they believed that their landlords would work with them in special situations. Also, the more timely the repairs and the more landlords were perceived as willing to work with tenants on special situations, the more satisfied tenants were with their overall living conditions.
The majority of tenants interviewed had considered purchasing a home, but many could not reach this goal due to financial obstacles. Programs that assist individuals in home buying could help make the purchase achievable, but not all tenants were aware of these services. There were some factors that showed a variation in whether tenants considered buying a home or knew of home buying programs. For example, Whites and African Americans were more likely than Latinos/Hispanics and Asians to have considered purchasing a home. In addition, women, Whites, African Americans, and those with some college education or higher were more likely to have known about home buying programs than others in the race/ethnicity and education categories.
The
following suggestions and recommendations are to improve tenants’
personal living conditions and make home buying more accessible to
those who are interested.
Increase and maintain quality housing that is affordable in the community
Increase knowledge of existing programs and create opportunities that can assist tenants in reducing costs. Some tenants complained about issues with insulation and heat. Considering the high cost of utilities during winter months, tenants who have to pay this utility bill can be offered programs that give suggestions and tools to reduce their energy use. Also, landlords could be offered incentives to increase the energy efficiency of their buildings, which would make the tenants more comfortable and decrease the utility cost. An example of this is a Town of Madison program that offers energy efficiency loans to landlords who rent to low- and moderate-income households.
Include mix of housing in future revitalization that is energy efficient and could increase community connections. During revitalization, mixed housing (e.g. size, ownership, price) should be included. Also, physical space requirements should be examined because households have different numbers of people and may require a variety of layouts and sizes of housing. In addition, single-family unit and apartment designs should be included that increase neighbor-to-neighbor contacts (e.g. front porches, common open space, etc.). Also, an important component given current environmental concerns and the eventual push towards energy efficiency is to design and build new housing that conserves resources, such as Yahara River View Apartments developed by Common Wealth Development.
Assess effectiveness and awareness of rental assistance programs that currently exist. Assess current rental assistance programs on a number of factors such as ease of application, ratio of applicants to program participants, and effectiveness at working with the community they are to serve. This information can be used to improve programs and shared in the broader community so others can benefit from the lessons.
Increase residents’ knowledge of issues of housing rights to address discrimination.
Tenants, as well as homeowners, mentioned facing both race- and class-based discrimination (for suggestions, see Chapter 3).
Create opportunities for South Madison organizations to connect. Assess organizations that currently do work in South Madison and build stronger relationships among organizations. These connections can benefit organizations by building synergies and decreasing overlap. They would also benefit the users of these programs because improved services would be offered and housing specialists and others who work in the community would know about different programs that are available. Information about these organizations should be compiled and made available in a website or printed material at the South Madison Branch Library. (Many assessments have already been done in South Madison and it may only be necessary to compile already existing studies.)
Improve landlord and tenant relations
Conduct more research with landlords to understand their perspectives and experiences. Improving the relationship between landlords and tenants can lead to more responsive and responsible landlords and tenants as well as better living conditions for renters. A requirement for success is that both landlords and tenants understand their rights and obligations and share responsibilities. In this report, tenants were interviewed about their housing situation; thus, the recommendations focus more on what landlords can do for tenants. However, to make this relationship work it is necessary to learn from landlords and understand their experiences; hence, more research needs to be conducted in this area.
Ensure that tenants have a clear understanding of their landlord’s rules and responsibilities. Landlords should give a clear idea of late rent policy and others if necessary.
Increase presence and usage of the Tenant Resource Center and other tenant focused organizations. It is important for tenants to understand their rights and obligations and to receive assistance regarding their housing issues. It is necessary to find the best ways for renters to receive this information, for example brochures on tenant support organizations could be handed out by the landlord at the signing of the lease. A user-friendly comprehensive website could be designed that would include information and organizations that assist tenants. There could be a link to this website at the South Madison Branch Library and also hard copies could be made available at the reference area. Furthermore, the Tenant Resource Center could hold office hours in South Madison on a regular basis.
Create more opportunities for tenants to be part of the community
Create ways for tenants to become involved in community activities. Tenants described sense of community as something they enjoyed and a reason they stayed in the area. Yet tenants seem to not have a lot of knowledge regarding neighborhood activities, such as revitalization. More outreach should be done with tenants and neighborhood activities should be planned to appeal to the common interests and concerns of homeowners and tenants.
Home buying process
Increase opportunities for South Madison residents to develop knowledge of home buying process and create connections with programs and housing representatives. The Home Buyers Roundtable of Dane County (group of individuals from the public and private sectors, as well as non-profit groups, who share a common goal of promoting homeownership through education) has a Home Buyers Fair in the spring that includes workshops and information tables. South Madison organizations should continue to collaborate with the Home Buyers Roundtable to make home buying more accessible for South Madison residents (e.g. transportation to Home Buyers Fair, workshops in South Madison).
Chapter 5: Conclusions
This chapter reviews the main themes, discusses possible next steps for South Madison Housing Stories and Experiences, and presents lessons learned from this project.
I. Major themes
A. Affordable housing
Compared to the city of Madison, South Madison has a different mix of housing (renter vs. owner occupied) and is less expensive. During the interviews, both homeowners and tenants mentioned that one of the major reasons they moved or stayed in the Bram’s Addition and Burr Oaks neighborhoods was the affordability of housing. Affordability means different things to different people. Many housing organizations consider a unit to be affordable if it costs no more than 30% of an individual’s or household’s gross income. For homeowners, this 30% includes mortgage payments, homeowners insurance, taxes, and utilities, while for renters it includes rent and utilities. According to the residents interviewed for this study, at least 56% of them (57% of homeowners and 55% of tenants) spent more than 30% of their income on housing costs; thus, they did not have housing units that met the standard definition of affordable. The affordability of a unit can change over time for an individual household.
This discussion of affordability should include factors such as the quality of the housing stock (e.g. necessary repairs and maintenance) and the changing economic situation of a community and surrounding areas. If housing stock is in poor condition, it may need major repairs that require substantial funds, which may prevent a household from creating a sustainable housing budget. For example, a homeowner may purchase a house that requires 30% of their income, but it may not be affordable in the long-run if their taxes or utilities increase at a faster rate than their wages.68 These factors can play a vital role in residents’ ability to afford and maintain their home in the long-run. One of the main objectives of this research project was to investigate different aspects of what made housing affordable or unaffordable for homeowners and tenants. By doing so, projects and policies can focus on how to keep housing affordable.
The first hurdle of home buying is the actual purchase. At this point, almost all homeowners mentioned that they received multiple forms of assistance from friends and family, real estate agents, bankers, government, and non-profit programs. This study found that the various demographic groups accessed and utilized different forms of assistance. For example, non-profit and government programs that offer financial assistance were used fewer times by residents who have less than a college education and were not used at all by Asian respondents. The majority of tenants considered the purchase of a home, but could not achieve this goal because of financial obstacles (e.g. lack of income and credit issues) and a lack of knowledge regarding existing home buying programs. This study found that tenants had different knowledge regarding home buying programs. For example, tenants from Burr Oaks had less knowledge of home buying programs than those from Bram’s Addition. Also, Latinos/Hispanics and Asians had less knowledge of home buying programs than White and African American participants. More outreach, along with an evaluation of program effectiveness, could be done to increase the number of consumers from underrepresented groups. In addition, the creation of a mentoring program may provide the personal one-to-one support that is sometimes needed to facilitate home buying and alleviate any problems that arise during the process.
Though purchasing their homes was the first major hurdle towards homeownership, maintaining their homes became the next hardship regarding affordability for almost half of the homeowners. The responsibilities of maintenance were a major challenge for homeowners in terms of skill, time, and cost with the ability to afford current repairs and budget for long-term repairs being especially difficult for some people. Even with this challenge, the majority of homeowners (73%) did not know of or utilize any financial or non-financial home maintenance programs. Making home maintenance programs more accessible and increasing the opportunities for skill acquisition could assist in making maintenance less of a challenge.
In terms of the quality of the housing stock and affordability, some tenants complained about issues with insulation and heat. Considering the high cost of utilities during winter months, tenants who have to pay this utility bill can be offered programs that give suggestions and tools to reduce their energy use. Also, landlords could be offered incentives to increase the energy efficiency of their buildings, which could make tenants more comfortable and decrease utility bills for either the tenant or landlord. Another important aspect may be to offer programs to landlords that defray the renovation costs towards energy efficiency so they are not passed onto the tenant.
Finally, the changing economic situation in the area was of concern to some residents as it pertains to affordability. Over the last decade, housing prices have increased throughout Madison. While concerned about the Citywide increase in housing prices, residents also expressed apprehension regarding the revitalization and its possible effects on housing and rental prices in South Madison and that it could decrease the affordability of housing in these neighborhoods. Community members were of mixed opinion regarding revitalization. Some felt that that it may improve the area and were positive about an improved image, better public amenities, and an increase in businesses, employment opportunities, and property values. However, respondents also expressed concern that revitalization could increase housing prices, rent, and taxes to the point where South Madison is no longer affordable for homeowners and tenants, especially low-income and elderly residents. To enhance the positive outcomes and minimize the possible negative consequences resulting from revitalization, this tension needs to be addressed, especially before prices increase to the point where it is no longer feasible for non-profits and others to undertake initiatives to maintain affordable housing in the area.
B. Tenant and landlord relations
The main factors in terms of how tenants view their relationship with their landlords and their housing situation in general are the frequency of communication, maintenance and upkeep of their home, and landlords’ response to special situations such as late rent.
All tenants mentioned that they talked with their landlords, though the levels of communication differed. A majority of tenants communicated with their landlords at least once a month or more. In general, landlords had a more routine maintenance schedule for duplexes or larger structures (i.e. apartments) than single-unit residences (i.e. houses). Tenants requested a variety of repairs that included plumbing, electrical, and appliances. In evaluating their overall living situations, tenants were less affected by the types of repairs than the time it took for landlords to respond to their requests. The majority of landlords completed repairs in less than a month, but some landlords never responded to tenants’ requests. As would be expected, tenants rated the quality of their relationships with their landlords higher the less time it took to do repairs, and if tenants perceived the repairs were completed in a timely manner. In addition, tenants also rated relationships higher if they believed that their landlords would work with them in special situations. Furthermore, tenants were more satisfied with their overall living conditions if their landlord communicated with them at least once a year, responded to their repair requests in a timely manner, and worked with them in special circumstances.
Considering that a major benefit of renting is that landlords, rather than tenants, have the responsibility for maintenance, the length of time it took to complete repairs and the timeliness of repairs is an important component in a renter’s overall perspective of their housing situation. Both tenants and landlords need to clearly understand each other’s rights and obligations. Tenants need to be aware of the responsibilities and obligations that landlords have for the upkeep and maintenance of their properties. One important way to do this is to increase the awareness of services offered by the Tenant Resource Center in Madison and other organizations that can assist tenants if difficult situations occur with their landlords or living conditions.
C. Importance of neighborhoods
The neighborhood and its positive and negative attributes are important components for how residents view their general housing and living situation. Respondents from Bram’s Addition and Burr Oaks shared their thoughts on what they considered the positive qualities and challenges of their neighborhoods, along with suggestions and recommendations they had to address their concerns.
Bram’s Addition and Burr Oaks neighborhoods include qualities that Jane Jacobs (1961), New Urbanists, and many others believe contribute to the production of good and livable communities. These qualities, which are also found in the study area, include different types of housing (price, size, layout, ownership), a multi-use area (residential as well as retail), human scaled streets (short blocks in the neighborhood with sidewalks), and nearby amenities and public spaces (stores, restaurants, social services, and parks). When interviewed, homeowners and tenants stated that the qualities they appreciated about their neighborhoods were a sense of community and good neighbors, shared personal and cultural background and diversity, access to neighborhood amenities and work, and affordable housing.
Although residents had many wonderful comments about their community, they also expressed concerns they feel need to be addressed to improve the livability of the area. Some areas they feel need to be improved are community relations, safety, and physical maintenance and upkeep of private and public spaces. They also mentioned the importance of economic development and affordable and quality housing.
II. Next steps
The main goal of this research was to get an understanding of the housing situation and the neighborhoods from multiple perspectives and to develop recommendations and action plans that reflect the concerns of the community. This is a three phase project: phase one was training and research; phase two included data analysis, report writing, and dissemination of findings; and during phase three, the research team will work to implement recommendations and action plans to improve the neighborhoods and housing situation for residents. With the completion of this report, the research team will begin the dissemination of findings and then move to the third phase of the project.
During this whole endeavor, the research team has worked to build partnerships with organizations, community members, and other stakeholders. Building partnerships will continue in the following phases. The next step will specifically involve disseminating information that will allow research team members to present their findings, request feedback, and invite collaboration. Local organizations have already expressed interest in hearing the research findings and recommendations.69
In order to build interest, gather feedback, and invite collaboration with South Madison residents, one idea has been to have a Community Town Supper that uses a shared meal, information dissemination, and discussion to engage diverse participants so that they can process complex issues and mobilize for action. Information from this study will also be disseminated to media outlets and the full report and other accompanying material will be made available on a website.
The development of action plans and the target recommendations implemented will depend on the interests of the collaborating partners, feedback from the findings, available support, and importance to the community.
III. Future research
South Madison Housing Stories and Experiences was a collaborative effort between the South Madison community and the UW.70 This collaboration brought together different viewpoints, strengths, and resources that served to broaden the understanding of the issues and allowed for the successful completion of this project.
Though there were many interesting questions and topics that could have been explored, the research focused on certain aspects of housing and community. However, as the research team engaged in the process and the analysis, they identified several topics that could be of interest for further investigation. In this section, research possibilities that could involve university and community partnerships are presented.
Community and University Participatory Research Center
The process of participatory research involves local voices by having them be part of a research team and interviewing residents in the community. This type of research process is a valuable method for building the skills of local residents, gathering reliable and useful information, strengthening collaborations, and increasing participants’ ownership of the project as a whole. As a consequence, this process can facilitate action among residents and other collaborators that influences community changes and policy.
In general, when community members start or are recruited to participate in a participatory research project, they come with expertise regarding their own experiences, but may lack the skills and understating of how to develop the project. The University of Wisconsin can play an instrumental role in supporting community research in the future. One possibility would be to develop a participatory research center in South Madison where local residents could offer their expertise about the local conditions and suggest research ideas to and receive training and support from faculty and students. This would also be a location where people can access information and make connections between studies. Faculty and students could be engaged in a variety of activities and sponsored by the University of Wisconsin to conduct research that is of interest and benefits the South Madison community. Some of the following research topics listed here would be well suited for this type of center.
Possible Research Topics
Investigate mixed-income neighborhoods. In order to ensure that quality and affordable housing remains available for tenants and homeowners in South Madison, it would be important to research the innovative projects taking place throughout the country and see how those experiences can be applied to the South Madison context
Gain an understanding of the obstacles residents face for staying in the home in the long- term. Explore reasons why tenants and homeowners who want to stay in their homes might have trouble. Determine and compose a list of what options might be available to people in those situations and make that information available to residents, governments, and developers in different ways.
Investigate property assessments, market values, and rental prices. Residents expressed concern that property assessments in South Madison may be higher than their market value, meaning that taxes are inflated. This claim needs to be investigated. If this concern is true, recommendations should to be made on how the issue can be remedied. Research can also be done on what tenants are currently paying and what is affordable.
Increase understanding of tenants in rental buildings larger than 4 units. Future research could focus on residents in the larger rental units to understand their experiences and viewpoints.
Better understand tenant and landlord relations from landlords’ perspectives. The research team conducted one focus group with landlords and their experiences were rich and illuminating (see Preliminary Findings with South Madison Landlords, Ideas for Future Research, and Interview Guide, Appendix G). More interviews or focus groups could be done with different types of property owners and landlords.
Learn about the relationships that exist across racial and ethnic groups. Given the prevalence of racial and ethnic diversity in these neighborhoods, understanding the current relationships across racial and ethnic groups and assumptions people have about their neighbors is an important topic for improving community relations and developing future collaborations.
Better understand and refine the findings regarding Latino and Asian community members. Though this study tried to interview Latino and Asian community members, there was a small sample. It would be useful to gather more information about these populations and their stories and experiences regarding housing and community. For example, one issue could be to research why Asian homeowners do not use non-profit financial assistance and what assistance they find useful.
Learn how to increase pedestrian safety. Traffic was a concern to community residents. Research that could be useful in these neighborhoods would include investigating the traffic calming methods that have been successful in other communities so that residents could apply these methods in their neighborhoods.
Compare myth vs. reality. Community members expressed concern about the negative perception of South Madison that many felt was not based on reality. Different variables can be compared between neighborhoods in Madison (e.g. police calls in Burr Oaks neighborhood as compared to Eken Park neighborhood) to verify if the negative perception is based on myth or reality.
Improve outreach and engagement regarding revitalization. Neighborhood activists are working very hard to increase resident participation, but it only seems to be having a minimal impact. Research could be done to explore creative methods that are being used throughout the country to increase public participation. In addition, work can be done with the diverse South Madison community to gain an understanding of their barriers to participation and what would increase their involvement.
Assess the prevalence of housing discrimination in Madison. First, see whether this research has been done; if not, then conduct research to assess the current level (reported and unreported) of housing discrimination in Madison. For example, explore how real estate agents sell property in South Madison and whether it is being marketed to certain ethnic and racial groups. This information could be used to develop other policies and regulations to address this problem
IV. Lessons learned
This was a collaborative project among three organizations and many individuals. The level of commitment needed to implement and carry out this project was enormous and the organization necessary to bring together the diverse participants with differing schedules was intense. Our goals were to create an inclusive environment where everyone could participate and conduct a useful and solid research project within a certain time period. The decisions made throughout the project kept those goals in mind, and, sometimes, these ideas of participation, research demands, and deadlines conflicted. As we evaluated what worked well and the challenges regarding this project, the authors of this final report thought it would be useful to share lessons learned so it may help others who are planning to embark on similar projects.
A. Recruitment and training schedule
The project organizers did a wonderful job recruiting community members for this project and had over 30 applicants. In order to have diverse perspectives on the research team, the organizers’ aim was to recruit a variety of individuals that represented the community in terms of their homeownership status (i.e. tenant or homeowner), age, gender, skills, race/ethnicity, and level of involvement in other community activities. After interviewing each interested applicant, we decided to hire 12 research team members.71 In the beginning, we hoped to meet on a few weekends for intensive training; however, some research team members had other responsibilities and could not meet at this time. To try to accommodate the entire research team’s schedule, we decided to find a weekly meeting time that worked for everyone.72 Even though it was nearly impossible to find a time that 12 research team members could get together, there were times when we did accomplish this task. But even after we set a specific time and date, unexpected issues arose with different research team members requiring them to be absent. In trying to assure that all research team members had a chance to learn the concepts and participate in all aspects of the project, it required many more meetings than we had anticipated, thus, extending the training period.
Lessons:
a) Though it is important to strive for diversity to represent the “community,” having fewer research team members to consider for logistics and knowledge of material would have shortened the training period (as well as the overall length of the project). Also, considering the difficulty of finding a weekly meeting time a few weekends of intensive work could have shortened the training period.
b) Ideally, it is important to have all the research team members learn the material at the same time. However, this may not be realistic given participants’ competing demands. It may have been helpful to find ways for research team members to learn the material that did not become the responsibility of the facilitator or organizers. For example, it may have been useful to pair research team members; thus, if someone could not make a meeting, they would contact their partner and review the material with them.
B. Timing and weather
When completing our original timeline, we did not consider the reality that winter in Madison, Wisconsin is a terrible time to conduct door-to-door interviews. Due to our funding, we were anxious to stay close to the proposed timeline. We began training in September, which means the earliest we could have started interviewing was January or February. Considering that these are two of the coldest months, door-to-door interviewing would have been very difficult. Instead, we delayed the interviewing in order to start in the spring.73 In hindsight, we should have started the training in early spring and interviewing in late spring or early summer.
Lesson:
In cold or hot climates, especially if it requires door-to-door interviewing, plan around weather!
C. Fieldwork
When we developed the questionnaires, we expected to spend about 20 minutes on an interview per household. In the end, we actually did conduct some interviews in 20 minutes or less, and some research team members were better at keeping within this period. However, in general, we underestimated how the social aspect of this work, as well as residents’ interest in this project, would lengthen the amount of time it took to conduct many of the interviews. Many of our research team members had connections to the community and knew many of the local residents, thus, part of the interview included some “catch up” time. Also, their familiarity with each other motivated residents to share many stories and experiences. Both homeowners and tenants took great interest in the project and were very generous with their time in many cases speaking to the research team members for an hour or more.
The extra time it took to do the door-to-door interviewing extended our fieldwork and an unfortunate consequence was that we lost some research team members who had not expected the project to take so long. In order to have enough interviewers’ to complete the project, one participant suggested we recruit more research team members to finish the second neighborhood. We put out a call to the community and university and immediately received responses from a number of interested people. They completed a few training sessions where the more experienced participants worked with the new research team members and practiced interviewing. With the help of the new research team members, we were able to finish the remaining neighborhood in a just a few weeks.
Lessons:
a) Having research team members who are part of their community and know local residents is an essential and beneficial component of doing participatory research. Therefore, extra interviewing time should be taken into account during the construction of the project timeline.
b) Though we worried whether recruiting more members later in the
project would be an issue in terms of the newer members feeling less
involved then the original members, recruiting more team members
instead added energy and did not lessen the participatory nature of
the project.
D. Data gathering and analysis
Due to the interest of the research team members, we developed a separate questionnaire for tenants and homeowners. Two questionnaires generated an enormous amount of data and allowed for rich analysis. However, the analysis was more labor intensive and time consuming than expected and required certain technical skills that we had not originally anticipated. Due to the work involved, it was easier to have only a few research team members participate in the analysis rather than the whole team.
While we were cleaning the data and entering the information on a spreadsheet, we realized research team members filled out answers differently. For example, some decided to write in an abbreviation for “not applicable” or “no response” while others did not write in anything at all, thus, making the coding more difficult.
The diversity of these neighborhoods is a treasure that many enjoy, though it can make communicating more difficult. One aspect that we found challenging was connecting with individuals who spoke Hmong or Spanish. We worked hard to successfully recruit several participants who speak these languages and have connections to the Hmong and Latino/Hispanic communities; however, we feel we still missed residents during the interviewing process.
Lessons:
a) It is important to carefully weigh the pros and cons of the different research methods, type of data to be collected, timeline of the project, labor pool available to work on the analysis, and type of participation expected from research team members. For example, we used two questionnaires with many open-ended questions. If we had only used one questionnaire for both homeowners and tenants and had mostly closed ended questions, it would have shortened the time for the analysis; however, the information collected would not have been as extensive.
b) More training time should have been devoted to filling out the questionnaires so that everyone used the same types of codes and abbreviations. Ideally, and with enough support, the facilitator and project coordinators could have entered the data every week and checked the surveys for inconsistencies. Typing in the data closer to the interview time would mean the interviewers would better recollect the interview and be able to clarify responses. Asking them to clarify their answers could have also improved their interviewing techniques.
c) In order to make sure we were interviewing the Hmong and Spanish speaking residents, we could have been more systematic. For example, though interviewers were keeping track regarding the houses they visited, there should have been better communication of where the interviewers found they needed a Hmong or Spanish translator. The translators could then have returned to those homes. This was done in a few instances; however, we believe there were some respondents who were never interviewed because of the language barrier.